
Best Countries for Indian Tea Exports in 2026
By Saurabh Mittal, Founder, Altus Exports
A market-intelligence guide to the best countries for Indian tea exports in 2026 — comparing UAE, Iraq, Russia, USA, Iran, UK, Germany, China, and emerging destinations on import demand, product fit, pricing, duties, compliance, and entry strategy. Written for Indian tea exporters, estate owners, blenders, and trade consultants who need prioritised destination selection rather than generic export process advice. Includes trade statistics, import data analysis, country-wise opportunity profiles, pricing benchmarks, CTC vs orthodox market fit, and expert insights from Altus Exports.
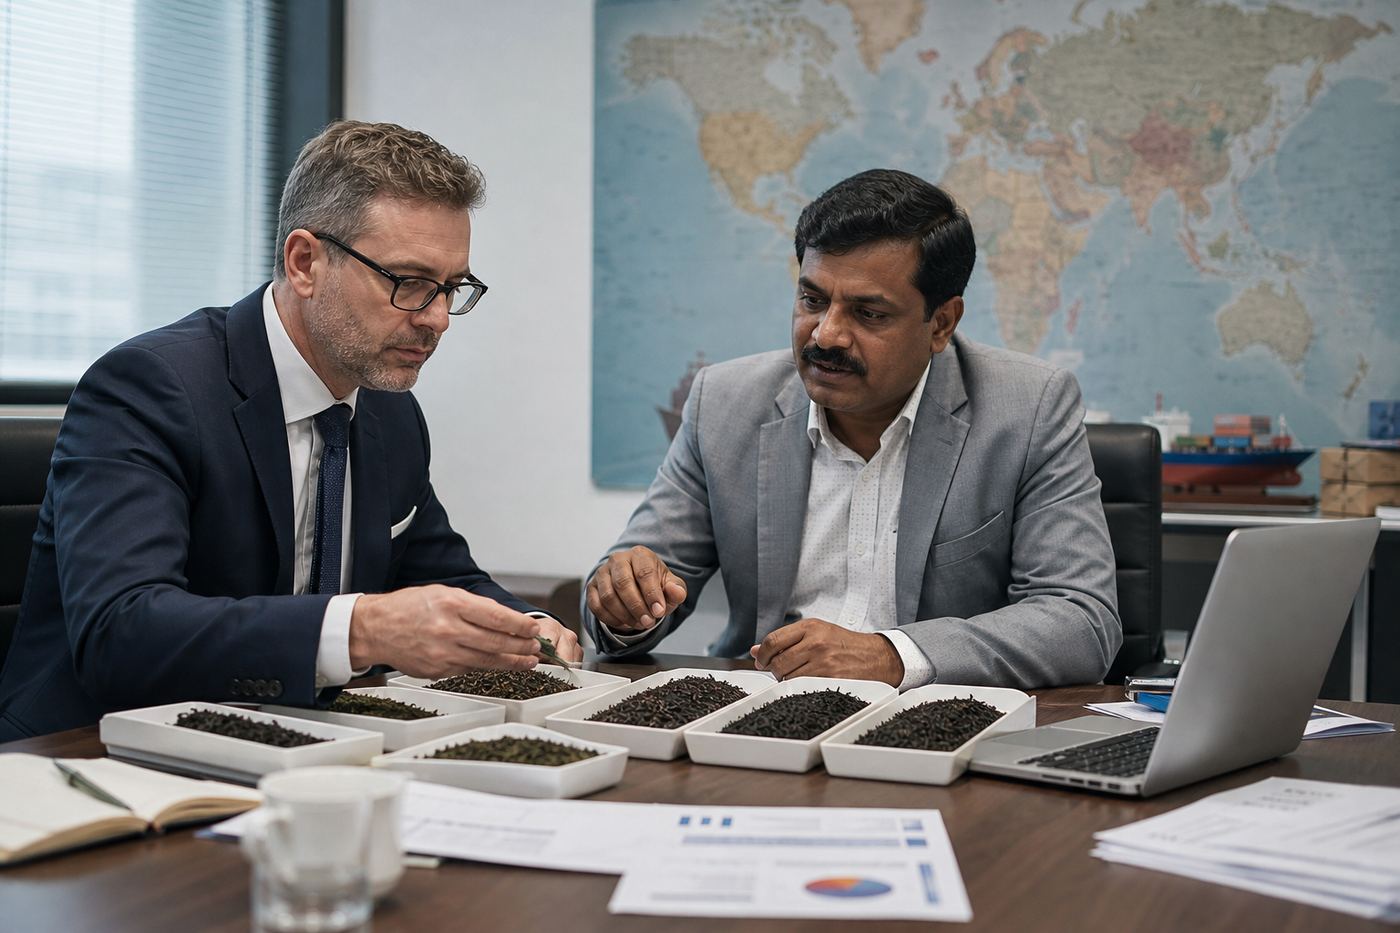
India is the world's second-largest tea producer and among the top five tea exporters by volume, shipping about 255–280 million kilograms in recent calendar years to more than 25 countries. Yet export success is not distributed evenly across destinations. The UAE, Iraq, Russia, USA, Iran, UK, Germany, and China absorb the majority of Indian tea export value — but each market demands a different product mix, price band, compliance posture, and relationship model. Choosing the wrong country first, or entering a premium market with commodity CTC that fails cupping standards, destroys margins faster than any freight surcharge.
This guide answers a specific question for Indian tea exporters, estate marketing teams, blenders, and export consultants: what are the best countries for Indian tea exports in 2026, and how should you prioritise among them? It is a market-selection playbook — not a rewrite of the full export process or product catalogue. For operational export steps, see How to Export Tea from India. For product variety depth, see Top Tea Products Exported from India. For buyer-side procurement, international importers should read How to Source Tea Directly from India.
India exports tea primarily under HS code 0902 — black tea (fermented) and partly fermented tea, green tea (unfermented), and scented or flavoured tea in smaller volumes. Black tea accounts for approximately 96% of Indian tea exports, dominated by Assam and South India CTC grades for Middle East, CIS, and North African markets, with orthodox Darjeeling, Assam, and Nilgiri whole-leaf grades serving UK, Germany, USA, and Japan premium channels. Tea Board of India registration, and FSSAI-aligned quality documentation underpin every commercial shipment. Altus Exports works as a merchant exporter in India and global sourcing partner connecting verified Indian tea supply with destination-market buyers — this analysis reflects field intelligence from those programmes.
Key Takeaways
Summary Box
- The best countries for Indian tea exports in 2026 are not interchangeable — UAE and Iraq demand volume CTC at aggressive pricing; UK and Germany reward orthodox and Darjeeling premiums; USA splits between foodservice commodity and specialty retail.
- Black tea (~96% of Indian exports) under HS 0902 30/40 dominates Middle East and CIS lanes; green tea and specialty orthodox require separate market strategies.
- UAE, Iraq, Russia, and Iran form the core Middle East/CIS volume cluster — fast payment cycles, price-sensitive, CTC-focused, with Iraq and Iran requiring specific blend profiles.
- UK and Germany are the primary European gateways — UK for Darjeeling and Assam orthodox heritage; Germany for organic, Fairtrade, and private-label specialty programmes.
- USA offers dual opportunity: commodity CTC for foodservice and iced-tea manufacturing, plus growing specialty Darjeeling and Nilgiri retail channels.
- China is a complex market — import volumes of Indian black tea are modest but growing in niche segments; do not treat China as a commodity CTC volume target without verified buyer relationships.
- Match your estate or blender capability to destination cupping standards before quoting — a failed trial shipment to Germany costs more than twelve months of successful Iraq volume.
- Altus Exports supports agriculture & food products export programmes with market-matched buyer introductions and documentation coordination.
Market Overview: Global Indian Tea Export Landscape in 2026
Global tea consumption continues to grow at approximately 2–3% annually, driven by Middle East and North Africa per-capita intake, rising ready-to-drink and iced-tea demand in North America, and premium loose-leaf revival in Western Europe and Japan. India competes primarily with Kenya, Sri Lanka, Vietnam, Indonesia, and China across different segments. Kenya dominates African CTC auction supply to Pakistan, Egypt, and UK commodity channels. Sri Lanka holds strong orthodox and high-grown positioning in Middle East premium and European specialty. Vietnam and Indonesia compete on green tea and lower-cost black tea in CIS and North Africa.
India's structural export advantage rests on four pillars: unmatched CTC production scale from Assam and South India, globally recognised Darjeeling GI-origin orthodox tea, diversified Nilgiri and Kangra specialty supply, and an established auction and private-sale infrastructure centred on Kolkata, Guwahati, Coonoor, and Siliguri. The Tea Board of India regulates export registration, issues exporter licences, and publishes monthly export statistics that should inform every annual market plan.
Through 2026, Indian tea exporters face headwinds from rising production costs (labour, fuel, packaging), currency volatility affecting FOB competitiveness against Kenyan auction prices, and increasing destination-market scrutiny on pesticide MRLs (maximum residue limits) — particularly in EU and Japan. Tailwinds include sustained Middle East demand recovery, growing US specialty tea retail, organic and Fairtrade certification adoption in Assam and Darjeeling estates, and buyer diversification away from Sri Lankan supply disruptions. Market selection in this environment is a margin-management decision, not merely a volume target.
Comparison table
Swipe →
Data table — swipe horizontally on small screens
| Dimension | 2026 Snapshot | Strategic Implication |
|---|---|---|
| Annual export volume | ~200–230 million kg (black tea dominant) | Volume markets (UAE, Iraq, Russia) absorb CTC; specialty is margin play |
| HS Code | 0902 — tea, mate; black (0902 30/40), green (0902 10/20) | Classify correctly for customs and buyer RFQs |
| Black tea share | ~96% of exports | CTC grades BP, BOP, BOPSM, PD, PF, Dust drive volume |
| Top 5 destinations (typical) | UAE, Russia, USA, UK, Iran | Validate quarterly via Tea Board export bulletins |
| Key origins | Assam, Darjeeling, Nilgiri, South India (Kerala, Tamil Nadu) | Match origin story to destination buyer expectations |
| Auction centres | Kolkata, Guwahati, Coonoor, Siliguri | Auction vs private contract pricing affects FOB floors |
| Regulatory body | Tea Board of India (export licence mandatory) | Registration benefits detailed in Tea Board guide |
| Quality gate | FSSAI, Tea Board export standards, buyer cupping | EU/Japan MRL compliance requires estate-level pesticide management |
Product Overview: What India Exports and Where It Fits
Summary Box
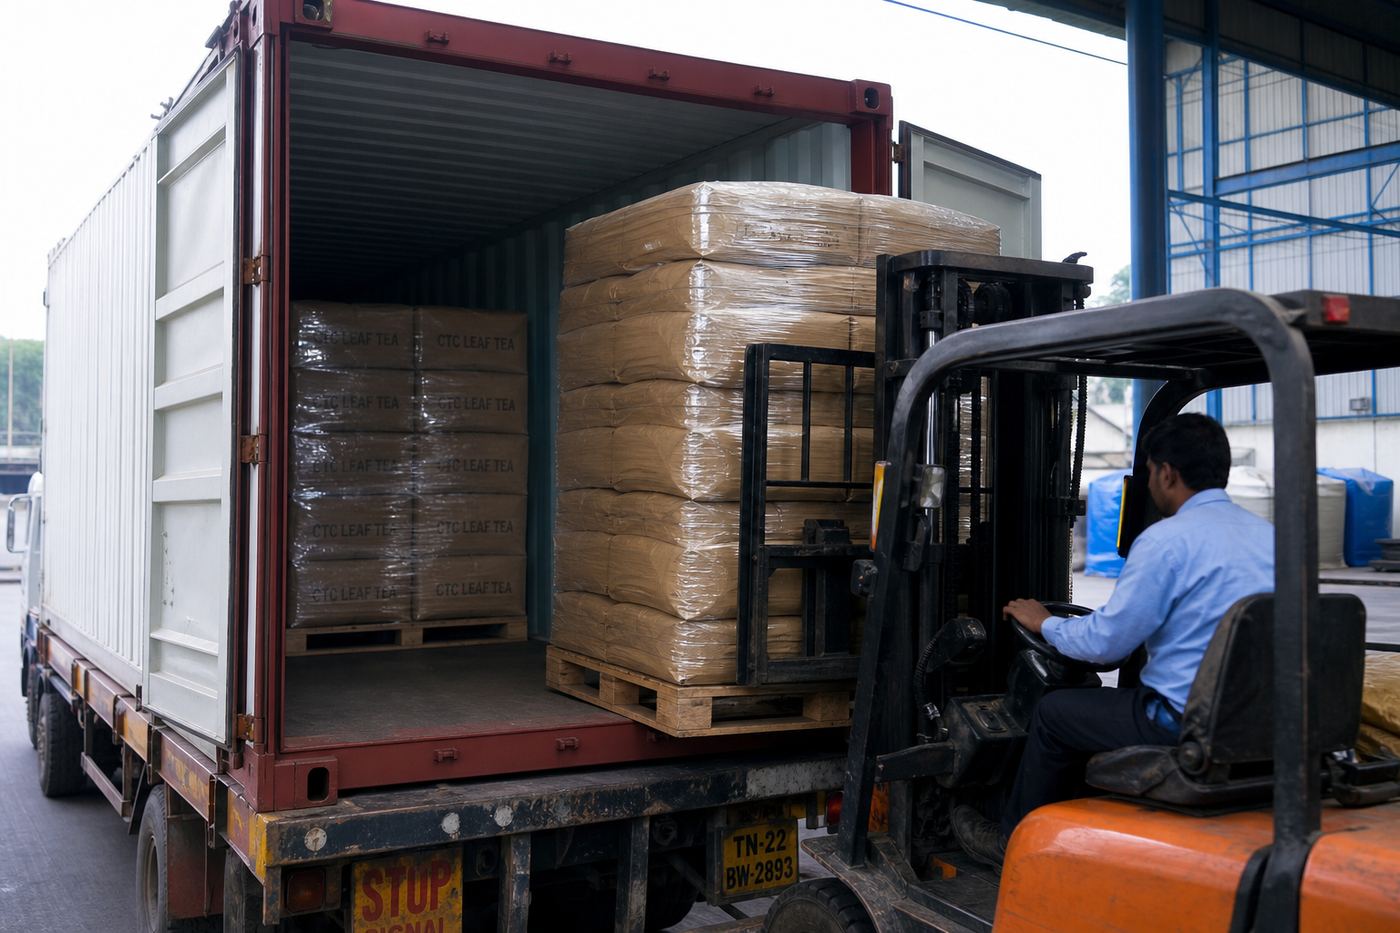
Understanding product-market fit is the foundation of country selection. India exports tea across a wide grade spectrum, but destination markets cluster around distinct product expectations. Sending the wrong grade to the wrong country — premium orthodox to an Iraqi commodity blender, or dusty CTC fanning to a German specialty importer — ends relationships before they begin.
Comparison table
Swipe →
Data table — swipe horizontally on small screens
| Product Category | Key Grades | Primary Origins | Best-Fit Destinations | Typical FOB Range (USD/kg) |
|---|---|---|---|---|
| CTC Black Tea (commodity) | BP, BOP, BOPSM, PD, PF, Dust, Fanning | Assam, South India | UAE, Iraq, Iran, Russia, Egypt, Libya | $1.80–$3.50 |
| Orthodox Black Tea | OP, OP1, FOP, GFOP, TGFOP, STGFOP | Assam, Darjeeling, Nilgiri | UK, Germany, USA, Japan, France | $4.00–$25.00+ |
| Darjeeling (GI origin) | First flush, second flush, autumnal | Darjeeling district | UK, Germany, USA, Japan, France, UAE premium | $8.00–$40.00+ |
| Green Tea | Chunmee-type, gunpowder, specialty | Darjeeling, Nilgiri, Assam (limited) | Morocco, USA, Germany, Japan, Afghanistan | $2.50–$12.00 |
| Organic / Fairtrade Tea | CTC and orthodox certified | Assam, Darjeeling, Nilgiri | Germany, UK, USA, Netherlands, Switzerland | $3.50–$30.00+ |
| Flavoured / Scented Tea | Masala blends, Earl Grey bases, jasmine | Blended at Indian units | USA, UK, UAE retail, Russia | $3.00–$15.00 |
| Instant Tea / Extracts | Soluble tea powder | Processing units | Japan, USA food manufacturing | $5.00–$20.00 |
CTC vs Orthodox: The Market Selection Fork
CTC (Cut, Tear, Curl) tea is India's volume engine — approximately 80% of domestic production and the vast majority of export tonnage. CTC produces small, granular particles ideal for quick extraction in bag tea, instant mixes, and strong brew profiles favoured in Middle East, CIS, and South Asian markets. Orthodox tea retains whole or partially rolled leaf structure, delivering nuanced flavour profiles valued in European and Japanese specialty channels.
If your supply chain is Assam CTC from auction purchases or direct estate contracts at BP/BOP/BOPSM grades, prioritise UAE, Iraq, Russia, Iran, and Egypt. If your supply chain includes Darjeeling orthodox, Nilgiri whole leaf, or certified organic Assam orthodox, prioritise UK, Germany, USA specialty, and Japan. Attempting to push CTC into German specialty retail is as futile as offering dusty fanning to a Dubai re-exporter serving Iraqi karak tea houses — the product exists, but the market does not.
Packaging and MOQ Expectations by Market Tier
- Commodity MOQ: 5–10 MT typical first order; 20-foot FCL (10–12 MT) standard for Middle East/CIS
- Specialty MOQ: 200 kg–2 MT trial; 5 MT+ for programme buyers
- Container load: 20-foot FCL holds ~10–12 MT tea; 40-foot FCL holds ~20–24 MT
- Lead time: 3–6 weeks from order confirmation to sailing for commodity; 4–8 weeks for specialty with cupping approval
- Incoterms: FOB Kolkata/Haldia/Cochin (Nhava Sheva for some South India programmes) most common for Indian exporters; CIF preferred by Iraqi and Iranian buyers
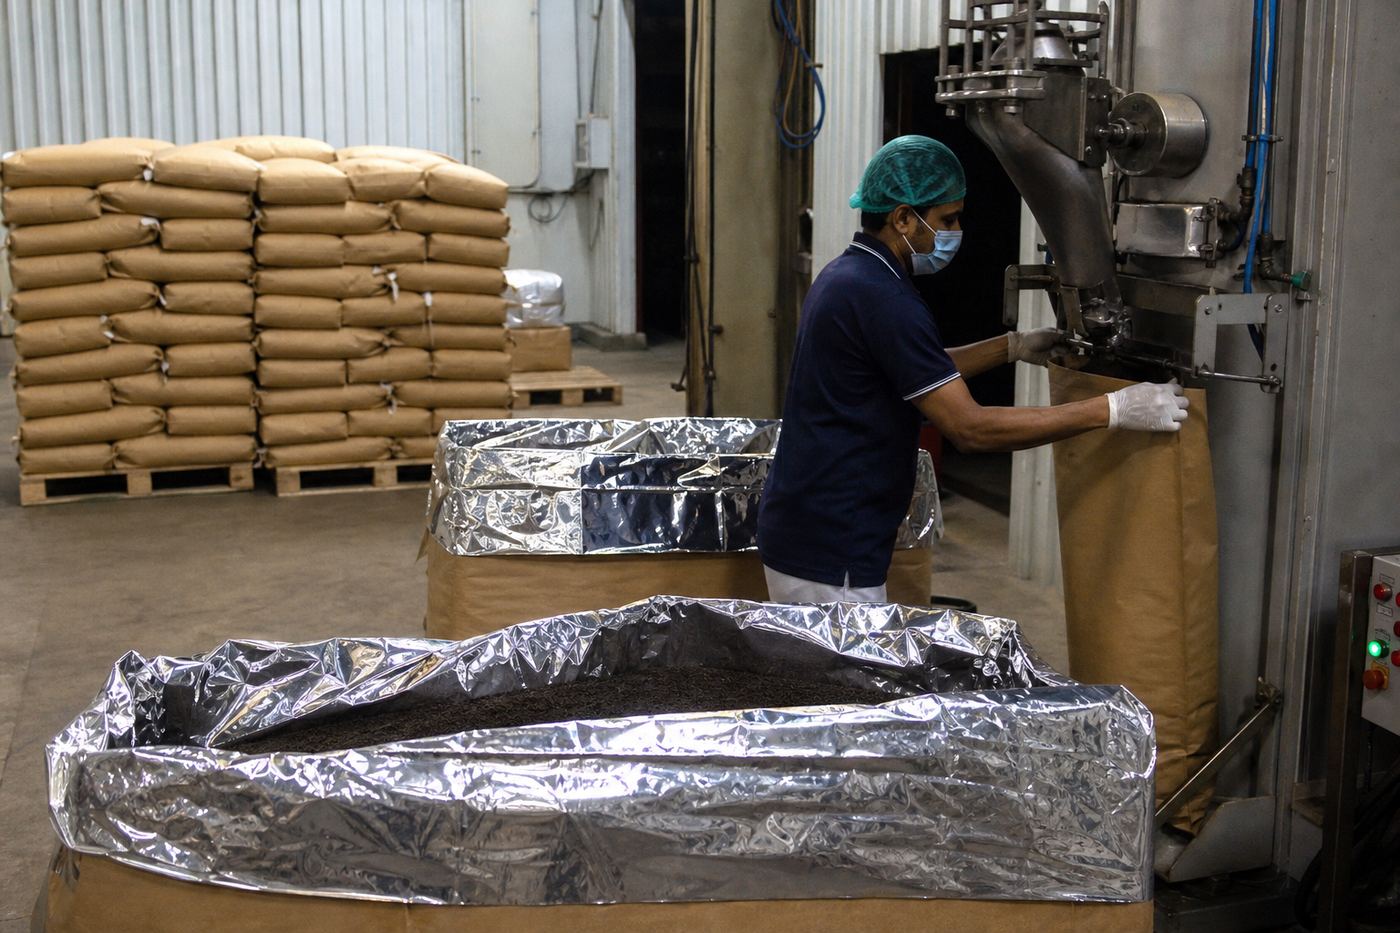
Commodity markets typically purchase in 30 kg or 60 kg polypropylene bags with inner foil liners, packed in corrugated cartons, palletised for container loading. Standard MOQ for a new exporter relationship is one 20-foot container (approximately 10–12 MT net depending on grade density) or a minimum 5 MT for established buyers. Premium orthodox programmes may start at 500 kg–2 MT for trial orders in multi-ply kraft bags or vacuum-sealed pouches. UK and German specialty buyers often require retail-ready packaging in subsequent order cycles — a packaging upgrade path should be planned before market entry.
Trade Statistics: Indian Tea Export Data Analysis
Key Statistics
Tea Board of India publishes monthly and annual export statistics by country, grade, and value — the primary authoritative source for validating market-selection hypotheses. DGFT and Ministry of Commerce trade data corroborate directionally. ITC Trade Map provides complementary import-side data for destination countries under HS 0902, useful for identifying whether a market imports more black or green tea, and from which competing origins.
Over the past five years, Indian tea export volume has remained relatively stable in the 200–230 million kg range, with value fluctuating based on rupee exchange rates and auction price cycles. The Middle East and CIS cluster (UAE, Iraq, Russia, Iran, Kazakhstan, Uzbekistan) consistently absorbs 40–50% of export volume. UK, Germany, and broader EU account for 8–12% by volume but 15–20% by value due to orthodox and Darjeeling premiums. USA volume has grown modestly, with specialty segments outpacing commodity growth rates.
Kenya remains India's primary auction-price benchmark competitor for CTC — when Kenyan auction prices dip below Indian equivalents, Middle East buyers shift sourcing quickly. Sri Lankan orthodox supply disruptions in 2022–2024 created temporary premium opportunities for Indian Darjeeling and Nilgiri in UK and German markets. Exporters who monitor these competitive dynamics quarterly adjust market mix faster than those locked into single-destination contracts.
Comparison table
Swipe →
Data table — swipe horizontally on small screens
| Destination Cluster | Approx. Volume Share | Approx. Value Share | 5-Year Trend | Primary Indian Grades |
|---|---|---|---|---|
| UAE + re-export hubs | 12–15% | 10–12% | Stable to growing | Assam CTC BOP/BOPSM, South India CTC |
| Iraq (direct + via UAE) | 8–12% | 7–9% | Volatile (geopolitical) | Strong CTC blends, PD, Dust for karak |
| Russia + CIS | 10–14% | 8–10% | Recovering post-sanctions shifts | CTC BP/BOP, flavoured tea |
| Iran | 6–9% | 5–7% | Sanctions-complex; indirect routes | CTC, GFOP orthodox for domestic market |
| USA | 5–8% | 7–10% | Growing specialty | CTC for foodservice; Darjeeling/Nilgiri specialty |
| UK | 4–6% | 6–8% | Stable | Darjeeling, Assam orthodox, English Breakfast blends |
| Germany + EU | 4–6% | 8–12% | Growing organic/Fairtrade | Darjeeling, Assam orthodox, organic CTC |
| China | 1–2% | 1–2% | Niche growth | Black orthodox, specialty Darjeeling |
| Other (Egypt, Libya, Afghanistan, Poland) | 15–20% | 12–15% | Mixed | CTC commodity, green tea |
Import Data Analysis: Reading Destination Demand Signals
Export market selection improves dramatically when Indian exporters analyse import data from the buyer's side — not only Tea Board export statistics. Import data reveals total market size, competitor origin share, grade preferences (inferred from unit values), and growth trajectories that export data alone cannot show.
How to Use Import Data for Market Prioritisation
- Pull HS 0902 import data for target countries from ITC Trade Map, Trade Data Monitor, or subscription platforms (ImportGenius, Panjiva).
- Segment by sub-heading: 0902 40 (bulk black) vs 0902 30 (retail-pack black) vs 0902 10/20 (green) to identify volume vs specialty opportunity.
- Compare India's share vs Kenya, Sri Lanka, Vietnam, Indonesia — a market where India holds <10% share with rising total imports signals room to grow.
- Analyse unit values: average CIF prices below $3/kg indicate commodity CTC markets; above $8/kg indicate specialty opportunity.
- Track 24-month trends, not single-year spikes — Iraq and Iran volumes are especially volatile and require rolling averages.
- Cross-reference with Most Demanded Indian Tea by Country for product-level demand mapping.
Import Data Signals by Priority Market
Comparison table
Swipe →
Data table — swipe horizontally on small screens
| Country | Import Volume Signal | India's Position | Data-Driven Action |
|---|---|---|---|
| UAE | Large re-export hub; total imports 50,000+ MT tea annually | India is top-3 origin | Focus on CTC price competitiveness vs Kenya; build re-exporter relationships |
| Iraq | Direct imports plus UAE transit; karak tea culture drives strong CTC demand | India is primary origin | Optimise blend profiles for strong, malty cups; expect CIF terms |
| Russia | Black tea imports 160,000+ MT pre-sanctions; rerouted via third countries | India competes with Sri Lanka, Vietnam | Monitor payment routes; flavoured tea niche growing |
| USA | Import value growing; specialty segment fastest | India is niche for Darjeeling; Kenya/Sri Lanka for commodity | Split strategy: CTC foodservice vs orthodox specialty |
| Iran | High per-capita consumption; import routes complex | India is historically significant origin | Work through established Dubai/Istanbul intermediaries |
| UK | Mature market; Darjeeling and Assam heritage | India is top origin for orthodox | Invest in GI documentation and estate traceability |
| Germany | Organic/Fairtrade import growth | India growing in organic segment | Pursue EU Organic, Fairtrade certification before entry |
| China | Massive domestic production; imports are premium/niche | India is minor origin | Target high-end black tea curiosity segment only |
Country-wise Opportunities: Detailed Market Profiles
Market Snapshot
The following profiles cover the eight priority destinations for Indian tea exporters in 2026, plus three emerging markets. Each profile is structured as a decision brief — validate pricing, payment terms, and regulatory requirements with current trade data and your buyer contacts before committing production.
1. United Arab Emirates (UAE)
- Demand profile
- Re-export trading, regional distribution, hospitality, retail (growing specialty)
- Preferred grades
- Assam CTC BOP/BOPSM, South India CTC, blended grades for Middle East taste profiles
- Pricing band
- FOB $2.00–$3.80/kg for commodity CTC; premium orthodox $6.00–$15.00/kg
- Payment terms
- Advance or LC common for new relationships; 30–60 day open account for established traders
- Compliance
- Halal-friendly processing preferred; FSSAI and Tea Board export documentation; standard food import permits
- Logistics
- FOB Kolkata/Haldia to Jebel Ali; 18–22 day transit; 20-foot FCL standard
- Key challenge
- Intense price competition from Kenyan auction tea; trader margin pressure
- Entry strategy
- Attend Gulfood (Dubai); build relationships with 3–5 established re-exporters; offer consistent container programmes, not spot lots
The UAE is India's largest tea export destination by volume in most years — not because Emirati consumers drink the most tea, but because Dubai and Jebel Ali function as re-export hubs serving Iraq, Afghanistan, CIS states, Africa, and wider Middle East markets. Indian exporters selling FOB to Dubai-based traders access a distribution network that no direct-sales effort to each end-market can replicate quickly.
2. Iraq
- Demand profile
- Volume commodity; karak tea houses, retail packs, institutional supply
- Preferred grades
- Strong CTC — PD, PF, BOP, BOPSM blends; high colour and briskness scores
- Pricing band
- CIF Umm Qasr/Basra $2.20–$3.50/kg depending on auction cycle
- Payment terms
- LC at sight or usance common; advance for new suppliers rare
- Compliance
- Iraqi food standards; Halal; moisture below 7%; clean cup (no chemical taint)
- Logistics
- CIF preferred; transit via Arabian Gulf ports; 25–35 days
- Key challenge
- Geopolitical volatility affects payment and shipping routes; direct vs UAE-transit routing
- Entry strategy
- Partner with UAE re-exporters with established Iraq channels; offer pre-shipment cupping aligned to Iraqi taste panels
Iraq is among the world's highest per-capita tea consumers, with karak tea (strong, spiced milk tea) culture driving demand for robust CTC grades that deliver colour, strength, and malty character in short brew times. Indian Assam CTC is the benchmark origin for Iraqi buyers — Kenyan and Sri Lankan alternatives exist but Indian malty profiles remain preferred.
3. Russia and CIS Markets
- Demand profile
- Black tea commodity + flavoured tea retail; gift packaging segments
- Preferred grades
- CTC BP/BOP for commodity; orthodox OP for premium; flavoured blends
- Pricing band
- FOB $2.00–$4.00/kg commodity; $5.00–$12.00/kg flavoured/premium
- Payment terms
- Varies by corridor; LC and third-country settlement mechanisms
- Compliance
- EAEU technical regulations for food; labelling in Russian; pesticide MRL alignment
- Logistics
- FOB to Indian ports; routing via intermediate hubs; 30–45 day transit
- Key challenge
- Payment and banking corridor complexity; currency volatility
- Entry strategy
- Work with experienced merchant exporters managing CIS programmes; attend WorldFood Moscow when accessible
Russia has historically been among the top three destinations for Indian tea, with strong black tea consumption and a flavoured-tea tradition (Earl Grey, bergamot blends, fruit-infused). Post-2022 trade route shifts have complicated direct payment and shipping, but demand persists through alternative corridors and CIS distribution.
4. United States of America
- Demand profile
- Foodservice commodity + growing specialty/organic retail
- Preferred grades
- CTC for industrial; Darjeeling first/second flush, Nilgiri, Assam orthodox for specialty
- Pricing band
- CTC $2.50–$4.50/kg FOB; specialty $8.00–$35.00/kg FOB
- Payment terms
- Advance or LC for first orders; Net 30–60 for established specialty buyers
- Compliance
- FDA food facility registration; FSMA; pesticide MRL per EPA tolerances; USDA Organic if claimed
- Logistics
- FOB to Nhava Sheva/Mundra; 25–35 days to East/West Coast
- Key challenge
- Specialty buyers demand estate traceability and cupping consistency; commodity competes with Argentina and Kenya
- Entry strategy
- Attend World Tea Expo; target specialty importers for orthodox; food manufacturing brokers for CTC
The USA is a dual-market opportunity: commodity CTC for iced-tea manufacturing, foodservice, and ready-to-drink bottlers; and specialty orthodox for premium retail, tea shops, and e-commerce brands. Indian exporters who conflate these segments waste marketing effort and fail cupping trials.
5. Iran
- Demand profile
- Volume black tea; domestic blending and retail packing
- Preferred grades
- CTC blends, GFOP orthodox for premium domestic segment
- Pricing band
- Competitive with Iraq benchmarks; CIF Bandar Abbas via intermediaries
- Payment terms
- Complex; often third-country settlement or barter-adjacent structures
- Compliance
- Iranian food standards; Halal; moisture and cleanliness critical
- Key challenge
- Sanctions compliance for Indian banks; routing and payment risk
- Entry strategy
- Only engage through experienced merchant exporters with established Iran programmes; never experiment with payment routes independently
Iran is one of the world's largest tea consumers per capita, with deep cultural attachment to strong black tea. Indian tea has historical market presence. Sanctions and banking restrictions complicate direct trade, but demand persists through established trading networks via UAE, Turkey, and other intermediaries.
6. United Kingdom
- Demand profile
- Orthodox specialty dominant; English Breakfast blend components; Darjeeling GI-critical
- Preferred grades
- Darjeeling FTGFOP1, STGFOP1; Assam TGFOP; Nilgiri OP
- Pricing band
- $6.00–$40.00+/kg FOB depending on flush and estate
- Payment terms
- LC or advance for new suppliers; Net 30–45 for established
- Compliance
- UK FSA; pesticide MRL; Darjeeling GI certification; Rainforest Alliance/Fairtrade if claimed
- Key challenge
- Extremely quality-sensitive; estate-level traceability expected; flush-specific sourcing
- Entry strategy
- Attend London Tea Fair; lead with specific estate and flush credentials; see Trade Shows for Tea Exporters
The UK is the spiritual home of Indian tea export — Darjeeling and Assam names carry heritage weight that no marketing budget can manufacture. UK buyers range from major blenders (Tetley, PG Tips supply chains) to specialty importers serving Fortnum & Mason, Whittard, and hundreds of independent tea merchants.
7. Germany and EU Markets
- Demand profile
- Organic, Fairtrade, specialty orthodox, flavoured retail
- Preferred grades
- Darjeeling organic, Assam orthodox, Nilgiri green, certified CTC for private label
- Pricing band
- $5.00–$30.00+/kg; organic premium 30–60% above conventional
- Compliance
- EU Regulation 396/2005 MRL; EU Organic if claimed; German LFGB; packaging (PPWR evolving)
- Key challenge
- Pesticide MRL failures are the primary rejection cause; EU documentation burden
- Entry strategy
- Obtain EU Organic or Fairtrade before approaching; attend BioFach and Interpack; partner with EU import broker
Germany is Europe's largest tea importer and a gateway to Austria, Switzerland, Netherlands, and Scandinavia. German buyers pioneered organic and Fairtrade tea sourcing and maintain the strictest pesticide MRL enforcement in the EU — making Germany a certification-heavy but premium-rewarding market.
8. China
- Demand profile
- Niche premium black tea; curiosity-driven specialty segment
- Preferred grades
- Darjeeling orthodox, high-grade Assam OP, Nilgiri specialty
- Pricing band
- Premium pricing possible for authentic GI Darjeeling
- Compliance
- GACC (General Administration of Customs China) registration for overseas food manufacturers; Chinese labelling
- Key challenge
- GACC facility registration is mandatory and time-consuming; market education required
- Entry strategy
- Not a volume CTC target; pursue only with GACC-registered processing units and verified Chinese importers
China is the world's largest tea producer and consumer — imports of Indian tea are modest in volume but strategically interesting in niche segments. Chinese consumers and tea businesses are developing curiosity for Indian black tea, particularly Darjeeling and high-grade Assam orthodox, as differentiated products in a market saturated with domestic green tea.
9–11. Emerging and Secondary Markets
- Egypt — Large CTC consumer; price-sensitive; Kenya is primary competitor; Indian opportunity in specific blend profiles during Kenyan supply gaps.
- Afghanistan — Transit via UAE/Pakistan routes; strong CTC demand; payment and logistics complexity similar to Iraq.
- Poland and Eastern Europe — Growing flavoured and bag-tea retail; private-label opportunity for Indian CTC and blend components.
- Japan — Ultra-premium Darjeeling and Nilgiri niche; strict MRL; small volumes, very high unit values.
- Saudi Arabia — Similar to UAE profile; Halal and quality documentation; re-export and domestic retail.
- For organic and specialty positioning across these markets, see Organic & Specialty Tea Export Opportunities from India.
Pricing Analysis: FOB Benchmarks and Margin Drivers
Buyer Tip
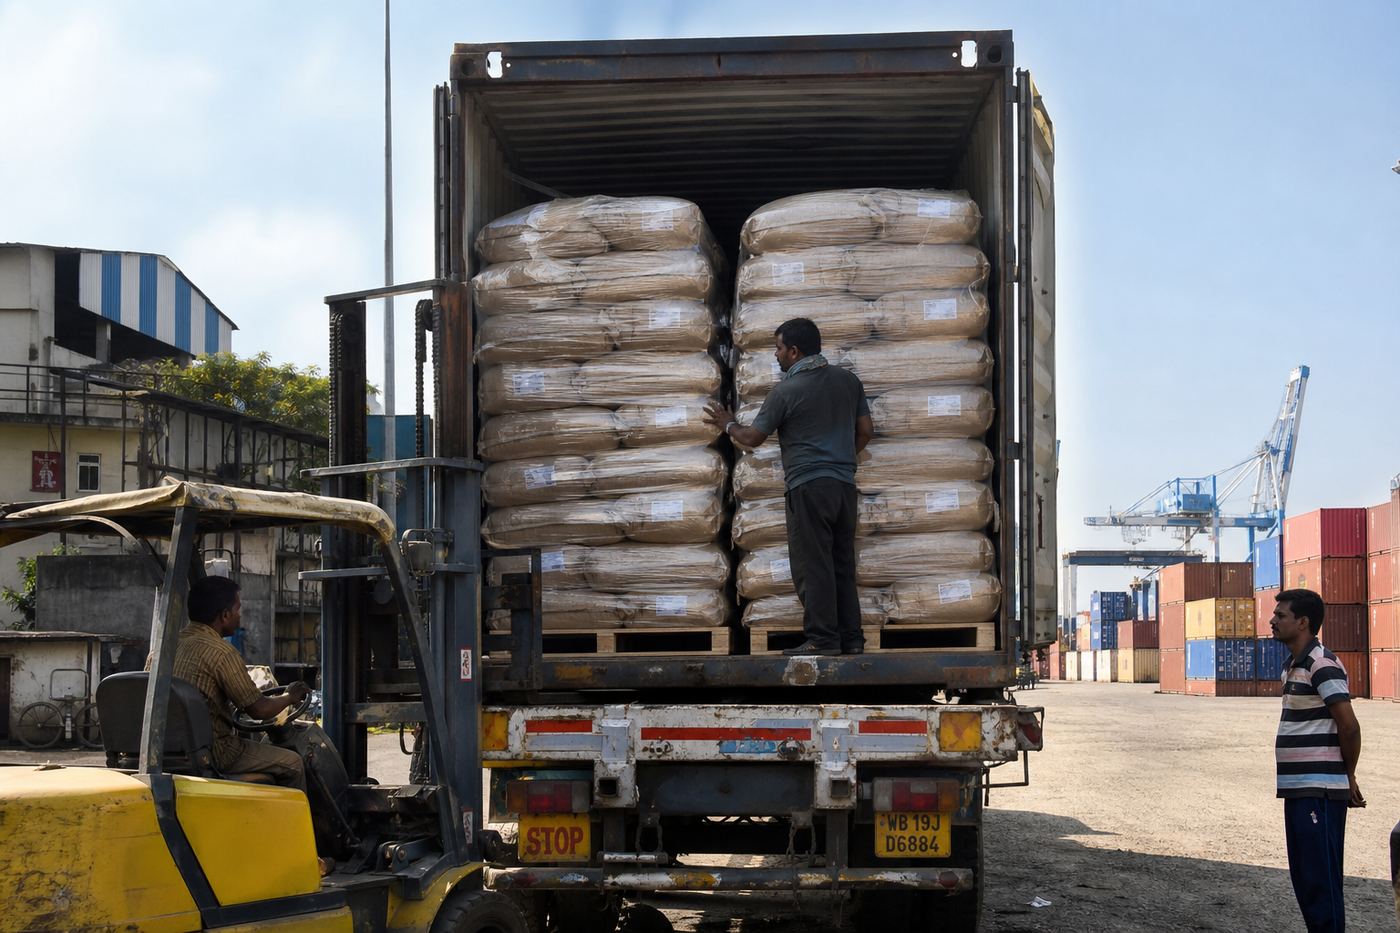
Tea export pricing follows auction cycles, currency movements, and destination-specific willingness to pay. Indian tea FOB prices are typically quoted from Kolkata, Haldia, or Cochin ports for bulk shipments. Understanding price floors by grade and destination prevents quoting markets where logistics and compliance costs erase margin before the container sails.
Comparison table
Swipe →
Data table — swipe horizontally on small screens
| Grade / Category | Auction Price Range (INR/kg) | Typical FOB (USD/kg) | Primary Destinations | Margin Driver |
|---|---|---|---|---|
| CTC BP (Assam) | ₹180–₹280 | $2.00–$3.00 | UAE, Russia, Egypt | Volume; auction timing |
| CTC BOP/BOPSM | ₹200–₹320 | $2.20–$3.50 | UAE, Iraq, Iran | Blend consistency; colour/briskness |
| CTC PD/PF/Dust | ₹160–₹250 | $1.80–$2.80 | Iraq, Libya, domestic blenders | Strong cup for karak; lowest grade pricing |
| Orthodox OP (Assam) | ₹350–₹600 | $4.00–$7.00 | UK, Germany, USA | Whole-leaf appearance; cup character |
| Darjeeling First Flush | ₹800–₹2,500+ | $10.00–$35.00+ | UK, Germany, Japan, USA | GI origin; flush timing; estate reputation |
| Darjeeling Second Flush | ₹600–₹1,800 | $8.00–$25.00 | UK, Germany, USA | Muscatel character; estate name |
| Nilgiri Specialty | ₹300–₹800 | $3.50–$10.00 | UK, USA, Germany | Clean cup; organic potential |
| Organic Certified CTC | ₹280–₹450 | $3.50–$5.50 | Germany, USA, UK | Certification premium 30–50% |
Incoterms and Landed Cost Considerations
FOB (Free on Board) is the dominant Incoterm for Indian tea exporters selling to UAE, UK, and USA buyers who arrange freight. CIF (Cost, Insurance, Freight) is preferred by Iraqi, Iranian, and some Russian buyers who want single-price landed quotes. Exporters quoting CIF must model ocean freight ($800–$1,500 per 20-foot container to Middle East; $1,200–$2,200 to Europe/US), marine insurance (0.3–0.5% of cargo value), and port handling at destination. DDP (Delivered Duty Paid) is rare in tea commodity trade and should be avoided by new exporters due to import duty complexity across 25-plus destination countries.
Common Pricing Mistakes
- Quoting UK specialty prices for Iraq commodity grades — different markets, different economics.
- Ignoring Kenyan auction price movements when quoting Middle East buyers — they check Nairobi prices daily.
- Failing to include packaging cost escalation (PP bag, carton, pallet) in FOB build-up.
- Not accounting for Tea Board export fees, FSSAI documentation, and pre-shipment inspection in margin calculation.
- Offering CIF without freight forwarder rate confirmation — vessel surcharges can erase 5–8% margin.
- Locking annual contracts without currency hedge awareness — rupee appreciation against dollar compresses FOB competitiveness.
Export Process: Market Entry Sequence (Not Full Export Guide)
Export Tip
Summary Box
This section covers the market-selection-specific export sequence — not the complete operational export process. For full documentation, registration, and shipping workflows, see How to Export Tea from India and the Tea Export Documentation Checklist.
Step 1: Audit Your Product Capability Against Target Markets
- List your available grades, origins, and annual volume capacity.
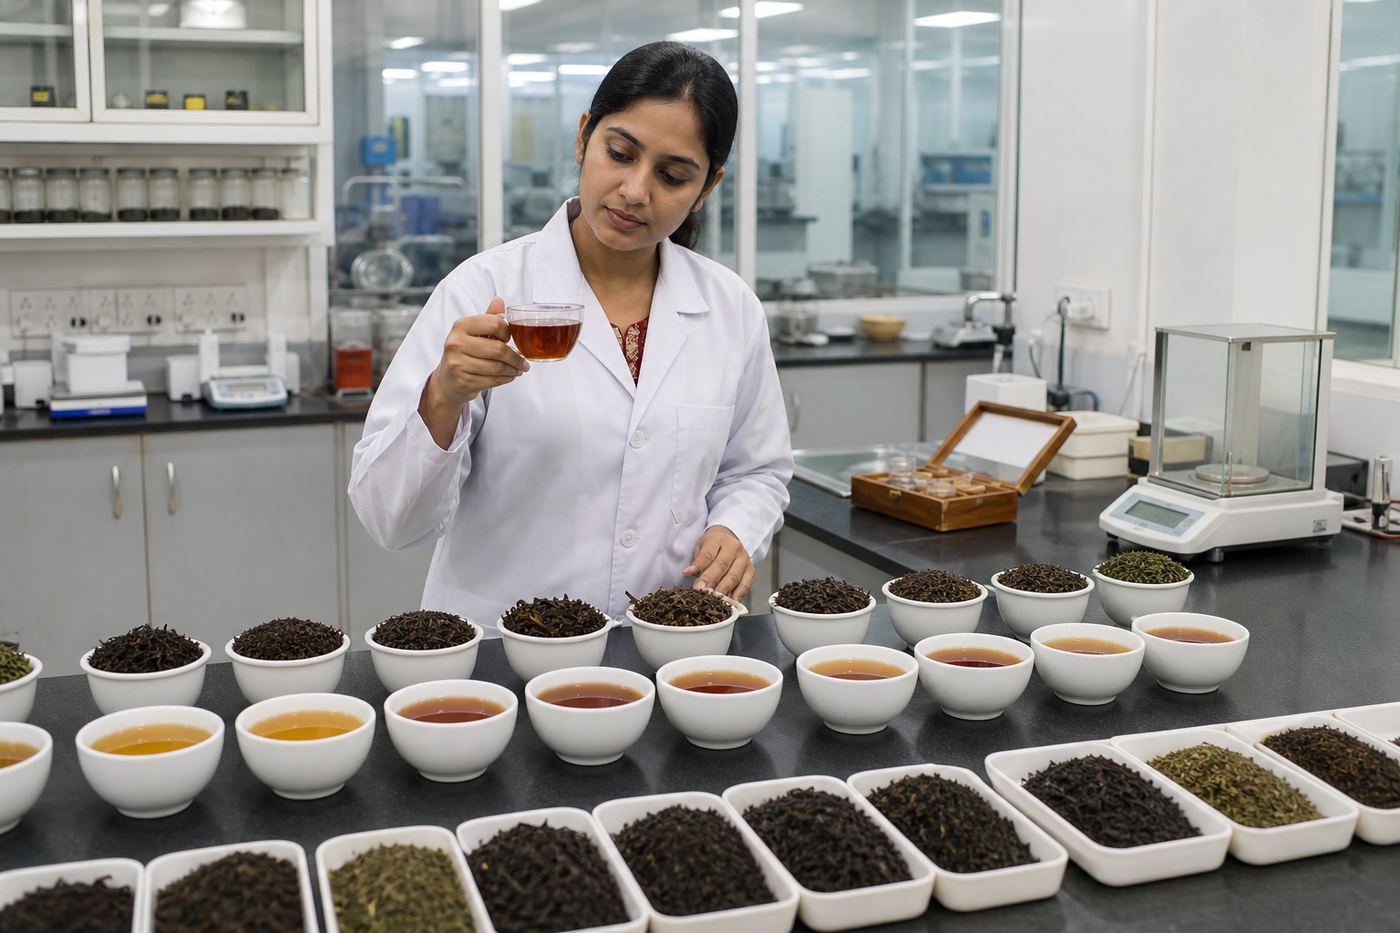
- Commission independent cupping evaluation mapped to target market taste profiles (Iraqi strong/malty vs German clean/nuanced).
- Confirm pesticide MRL compliance capability for EU/Japan if targeting those markets.
- Match capability matrix to country profiles in this guide — eliminate mismatches before spending on buyer outreach.
Step 2: Shortlist 2–3 Priority Countries for Year One
First-year exporters should not spread across eight countries. Select one volume market (UAE or Iraq) for cash-flow stability and one premium market (UK or Germany) for margin learning — if your product mix supports both. Russia and Iran require experienced payment corridor management and are not recommended as first markets.
Step 3: Validate with Trade Data and Buyer Meetings
Cross-reference your shortlist against Tea Board export statistics and ITC Trade Map import data. Attend one targeted trade show — Gulfood for Middle East, London Tea Fair for UK, World Tea Expo for USA, BioFach for Germany. See Trade Shows for Tea Exporters and Find International Buyers for Tea.
Step 4: Trial Shipment and Market Feedback Loop
Execute one container trial to your volume market and one small-lot trial (200–500 kg) to your premium market. Collect cupping feedback, document rejection reasons if any, and adjust grade selection before scaling. Trial economics are learning investments — budget for them explicitly.
Step 5: Scale Programmes and Diversify
Once trial markets validate, move from spot sales to quarterly or annual programmes with 2–3 anchor buyers per country. Diversify to a third country only after programme stability in the first two. Annual market review should revisit this guide's country profiles against updated trade data.
Challenges & Solutions: Market-Specific Risk Matrix
Comparison table
Swipe →
Data table — swipe horizontally on small screens
| Challenge | Affected Markets | Impact | Solution |
|---|---|---|---|
| Kenyan price undercutting | UAE, Iraq, Egypt, Russia | Lost contracts within weeks | Build blend differentiation; lock forward contracts at auction; offer cupping consistency guarantees |
| Pesticide MRL failure | Germany, UK, EU, Japan, USA specialty | Consignment rejection; brand damage | Estate-level IPM; pre-export multi-residue testing; organic certification pathway |
| Payment corridor risk | Iran, Russia, Iraq (direct) | Delayed or blocked payments | Use experienced merchant exporters; LC at sight; avoid experimental routes |
| Darjeeling GI misuse | UK, Germany, USA, Japan | Legal action; buyer trust destruction | Source only Tea Board-licensed Darjeeling exporters; verify GI certificates |
| Moisture and mould in transit | All markets (especially humid destinations) | Quality degradation; rejection | Moisture below 7%; proper PP bag sealing; desiccant in containers for long routes |
| Auction price volatility | All commodity markets | Margin erosion on fixed-price contracts | Index contracts to auction averages; include price revision clauses |
| Currency fluctuation | All USD-denominated exports | Unpredictable INR realisation | Forward cover for large contracts; shorter pricing validity periods |
| Packaging non-compliance | EU (PPWR evolving), USA retail | Import hold at destination | Confirm packaging specs with buyer before production; use food-grade certified materials |
| Buyer concentration risk | Single-market dependency | Revenue collapse if market shifts | Maintain 3+ destination countries by year three |
| Documentation mismatch | Germany, UK, USA | Customs hold; demurrage costs | Use Tea Export Documentation Checklist; CHA review before sailing |
Expert Insights: Market Selection Framework from Altus Exports
Expert Insight Box
Altus Exports evaluates destination markets for Indian tea clients using a weighted scoring model across five dimensions: product-grade fit (30%), import demand trend (20%), pricing and margin potential (20%), compliance burden (15%), and payment/logistics reliability (15%). Markets scoring above 70/100 enter the active pursuit list; markets below 50 are deprioritised regardless of anecdotal buyer interest.
For a typical Assam CTC exporter with 50 MT monthly capacity, our 2026 recommendation is: primary — UAE (programme stability and re-export network); secondary — Iraq via UAE channel partners (volume and cultural product fit); exploratory — UK orthodox only if estate partnerships provide genuine OP/TGFOP supply, not auction dust repackaged. Recommending Germany or Japan to a CTC-only exporter without MRL-compliant estate sourcing would be a disservice — and we decline those engagements rather than facilitate failed trials.
International buyers reading this guide from the import side should pair it with How to Source Tea Directly from India for procurement workflow and Most Demanded Indian Tea by Country for demand-grade alignment. Altus coordinates export products from India and product sourcing from India under one accountable relationship.
Shipping, Containers, and Logistics by Destination Lane
- 20-foot FCL capacity: approximately 10–12 MT net tea depending on grade density and pallet configuration.
- 40-foot FCL capacity: approximately 20–24 MT net — use for large UAE or Iraq programmes to reduce per-kg freight.
- LCL shipping: viable for 2–5 MT trial shipments but increases contamination and moisture exposure risk — seal PP bags meticulously.
- Insurance: marine cargo insurance at 0.3–0.5% of invoice value is standard under CIF; confirm coverage includes moisture damage.
- Pre-shipment inspection: EIC or Tea Board inspection at load port recommended for first three shipments to any new destination.
Market selection and logistics economics are inseparable for tea export. A destination that offers strong demand but prohibitive freight costs or extended transit times erodes FOB margin before the buyer opens the container. Indian tea ships primarily from Kolkata/Haldia for Assam and Darjeeling programmes, Cochin for South India origin, and occasionally Nhava Sheva for western/southern sailings. Exporters and buyers should model total landed cost — not FOB alone — when comparing UAE against UK against USA.
Tea is a dense, non-refrigerated commodity that loads efficiently in dry containers. Standard stowage is palletised cartons stacked floor-to-ceiling in 20-foot or 40-foot FCL containers. Reefer containers are rarely needed for black tea unless transiting extreme heat corridors during summer months with marginal moisture control at origin. Ventilation and desiccant sachets are recommended for shipments to humid destinations (Southeast Asia, West Africa) or routes exceeding 35 days transit.
Comparison table
Swipe →
Data table — swipe horizontally on small screens
| Destination | Primary Indian Load Port | Transit Time | Typical 20-FCL Freight (USD) | Logistics Note |
|---|---|---|---|---|
| UAE (Jebel Ali) | Kolkata / Haldia | 18–22 days | $800–$1,200 | Shortest major lane; highest sailing frequency |
| Iraq (via Umm Qasr) | Kolkata via Gulf transshipment | 25–35 days | $1,000–$1,600 | CIF quotes should include transshipment risk |
| Russia (via intermediate hub) | Kolkata / Cochin | 30–45 days | $1,200–$2,000 | Routing varies; confirm with forwarder monthly |
| UK (Felixstowe / London) | Kolkata / Haldia | 28–35 days | $1,400–$2,200 | Post-Brexit UK customs separate from EU |
| Germany (Hamburg / Bremerhaven) | Kolkata / Haldia | 30–38 days | $1,500–$2,300 | EU customs clearance at entry port |
| USA East Coast | Kolkata via transshipment | 30–40 days | $1,600–$2,500 | ISF filing 24 hours before loading |
| USA West Coast | Kolkata via Singapore/Busan | 35–45 days | $1,800–$2,800 | Longer transit; plan moisture controls |
| China (Shanghai / Shenzhen) | Kolkata / Cochin | 15–25 days | $600–$1,100 | Short transit; GACC registration mandatory |
Future Outlook: Indian Tea Export Destinations Through 2030
Through 2030, Indian tea export destination mix will be shaped by five forces: Middle East and CIS demand stability, European organic and sustainability premium growth, US specialty tea retail expansion, climate impact on Assam and Darjeeling yields, and geopolitical routing changes affecting Iran, Russia, and Iraq corridors.
The UAE will likely remain India's largest export destination by volume, but margin pressure from Kenyan competition will intensify. Exporters who differentiate on blend consistency, cupping reliability, and programme pricing will retain UAE share; those competing only on spot price will lose ground. Iraq and Iran represent volume stability with geopolitical risk — buyers and exporters who maintain diversified payment and routing structures will outperform single-corridor dependence.
UK and Germany will grow as value destinations faster than as volume destinations. Darjeeling GI protection, EU Organic adoption, and Fairtrade certification at Indian estates will unlock premium FOB tiers that commodity CTC cannot access. US specialty tea market growth — driven by direct-to-consumer brands, tea shop chains, and wellness positioning — creates a multi-year opportunity for Indian orthodox and single-estate programmes, particularly Darjeeling and Nilgiri.
China remains a long-term niche play. Indian black tea imports into China will grow slowly as curiosity premium, not as commodity replacement. GACC-registered estates with authentic Darjeeling and Assam orthodox may build small but high-value programmes. India should not divert CTC export capacity to pursue Chinese volume at the expense of established Middle East relationships.
Emerging secondary markets — Poland, Saudi Arabia, Kazakhstan, Afghanistan, and Egypt — offer diversification for exporters who have stabilised their primary two or three destinations. Altus Exports recommends annual market portfolio review using the scoring framework in this guide, updated with fresh Tea Board statistics and ITC Trade Map import data.
Case Study: Assam CTC Exporter Pivoting from Single-Market UAE to Iraq + UK Dual Strategy
Challenge: A Guwahati-based tea export firm had sold 90% of its annual 600 MT output to two Dubai traders for five years. When Kenyan auction prices dropped 15% in early 2025, both traders demanded matching price cuts that erased exporter margin entirely. The firm faced a choice: compete on price in a race to the bottom, or diversify destinations while negotiating from a position of market optionality.
Approach: Altus Exports conducted a market-selection audit using the scoring framework described above. UAE remained primary but with renegotiated index-linked pricing tied to Kolkata auction averages. Iraq entered as secondary volume market — cupping panels confirmed the exporter's BOPSM grade delivered the strong, malty, colourful cup Iraqi karak blenders require. A 200 kg trial of Assam orthodox TGFOP was separately introduced to a UK specialty importer identified through London Tea Fair contacts.
Execution: First Iraq-bound container (10 MT CIF via Dubai consolidation) sailed within eight weeks of cupping approval. UK trial lot was air-freighted for freshness evaluation. Tea Board export documentation, FSSAI compliance, and pre-shipment inspection were coordinated in parallel. The Iraq buyer confirmed a quarterly 40 MT programme within two months. The UK buyer placed a 1 MT second-flush order at FOB $11.50/kg — 4× the commodity CTC margin.
Results: After twelve months, the exporter's revenue mix shifted to 55% UAE, 30% Iraq, 15% UK specialty. Blended average FOB improved 18% over the prior UAE-only model despite lower UAE volume share. Payment reliability improved because no single buyer controlled more than 55% of revenue.
Lessons learned: Market diversification is not about shipping to more countries — it is about matching specific grades to specific country taste profiles and building programme relationships, not spot transactions. The Iraq opportunity existed for years but was invisible to an exporter locked in a comfortable UAE duopoly.
Executive Summary
Summary Box
This market-selection guide is for Indian tea exporters, estate owners, and merchant exporters deciding where to deploy Assam CTC or orthodox capacity in 2026. Scan the summary boxes first, then use country tables for demand, duties, and entry strategy under HS 0902.
Recent Tea Board data puts Indian tea exports near 255–280 million kg a year, still dominated by black tea. Country ranking therefore hinges on CTC vs orthodox fit and compliance cost — not on sending the same catalogue to every importer.
Buyer Requirements
Buyer Requirements
- Grade and manufacture method stated on every quote (CTC/orthodox + grade letters).
- Cupping approval recorded against a sealed sample retained by both parties.
- Destination compliance notes (residues, Halal, organic, GI) agreed before production.
- Payment terms and inspection windows written into the proforma.
Destination buyers differ on Halal, organic, and residue tests, but almost all still ask for Tea Board exporter proof, FSSAI, sealed cupping samples, lot COA, pack specs, and written FOB/CFR with MOQ before programme volume.
Common Buyer Mistakes
Common Mistakes Box
- Ordering 'Indian tea' without CTC/orthodox, grade, and pack detail.
- Skipping cupping approval and disputing liquor after arrival.
- Assuming APEDA or Spices Board credentials cover tea exports.
- Comparing suppliers on FOB alone without landed-cost and document risk.
- Over-ordering first containers before proving grade consistency across lots.
Most first-shipment tea failures are process failures, not leaf failures. Avoid the patterns below before you fund samples or containers.
Sourcing Checklist
Checklist
- Written spec: origin, CTC vs orthodox, grade, pack, Incoterm, HS 0902 sub-heading.
- Verify Tea Board exporter licence and FSSAI independently.
- Approve cupping sample and lot COA before scaling volume.
- Confirm packaging standard, MOQ stage, and lead time in writing.
- Model landed cost (freight, duty, brokerage) — not FOB alone.
Before you shortlist a destination market, confirm the buyer can clear the grade you actually supply. This checklist aligns market choice with RFQ clarity, cupping proof, and document readiness for importers and procurement teams.
Exporter Checklist
Checklist
- IEC, GST, FSSAI, and Tea Board exporter licence are current.
- Grade sheet, cupping protocol, and pack format are locked.
- Lot COA template matches invoice and packing-list fields.
- Port, stuffing plan, and Incoterm are confirmed with the CHA/forwarder.
- Buyer claim window and rejection terms are agreed before sailing.
Exporters and merchant partners should clear this readiness list before outreach or first stuffing. It reduces document mismatches and cupping disputes on the first FCL.
Compliance Checklist
Checklist
Compliance Notes
- Tea Board exporter licence covers the exporting entity for HS 0902.
- Correct 0902.10/20 (green) or 0902.30/40 (black) by pack weight.
- Organic/GI claims have lot-linked certificates before packing completes.
- Destination residue, Halal, or label rules are reflected in the document pack.
- Lot numbers match across invoice, packing list, COA, and cartons/sacks.
Scan this compliance box before filing the shipping bill. Tea has its own statutory pathway — do not reuse APEDA or Spices Board credential assumptions.
Conclusion
- Indian tea exporters: Shortlist 2–3 countries using this guide's profiles; validate with Tea Board and ITC Trade Map data.
- International buyers: Use Source Tea Directly from India for procurement workflow aligned to your market's grade requirements.
- Explore merchant exporter services and global sourcing partner India for market-matched export programmes.
- Review Top Tea Products Exported from India for product-depth and Most Demanded Indian Tea by Country for demand mapping.
- Attend targeted events listed in Trade Shows for Tea Exporters and build buyer pipeline via Find International Buyers for Tea.
- Browse agriculture & food products for industry context and export products from India for multi-category support.
The best countries for Indian tea exports in 2026 are UAE, Iraq, Russia, USA, Iran, UK, Germany, and China — but not for every exporter and not with every grade. Commodity Assam and South India CTC belongs in Middle East and CIS volume markets where cupping standards reward strength, colour, and price. Darjeeling orthodox, Nilgiri specialty, and certified organic teas belong in UK, German, and US specialty channels where origin stories and compliance documentation convert to premium FOB.
Market selection is the highest-leverage decision in tea export — higher than packaging optimisation, higher than freight negotiation, and higher than trade-show attendance. Validate your product capability, score destinations using trade data and the country profiles in this guide, execute trial shipments, and scale programmes — not spot deals. Complete your Tea Board registration and export documentation readiness via Tea Board Registration Benefits for Exporters before pursuing international buyers.