
India vs China Manufacturing: Cost, Quality, MOQ and Lead Times Compared
By Saurabh Mittal, Founder, Altus Exports
Compare India vs China manufacturing on the same frozen spec using four dimensions: cost structure, quality access, MOQ economics, and realistic lead time including samples. China often leads on scale; India often competes on MOQ flexibility and category depth—factory performance beats country averages.
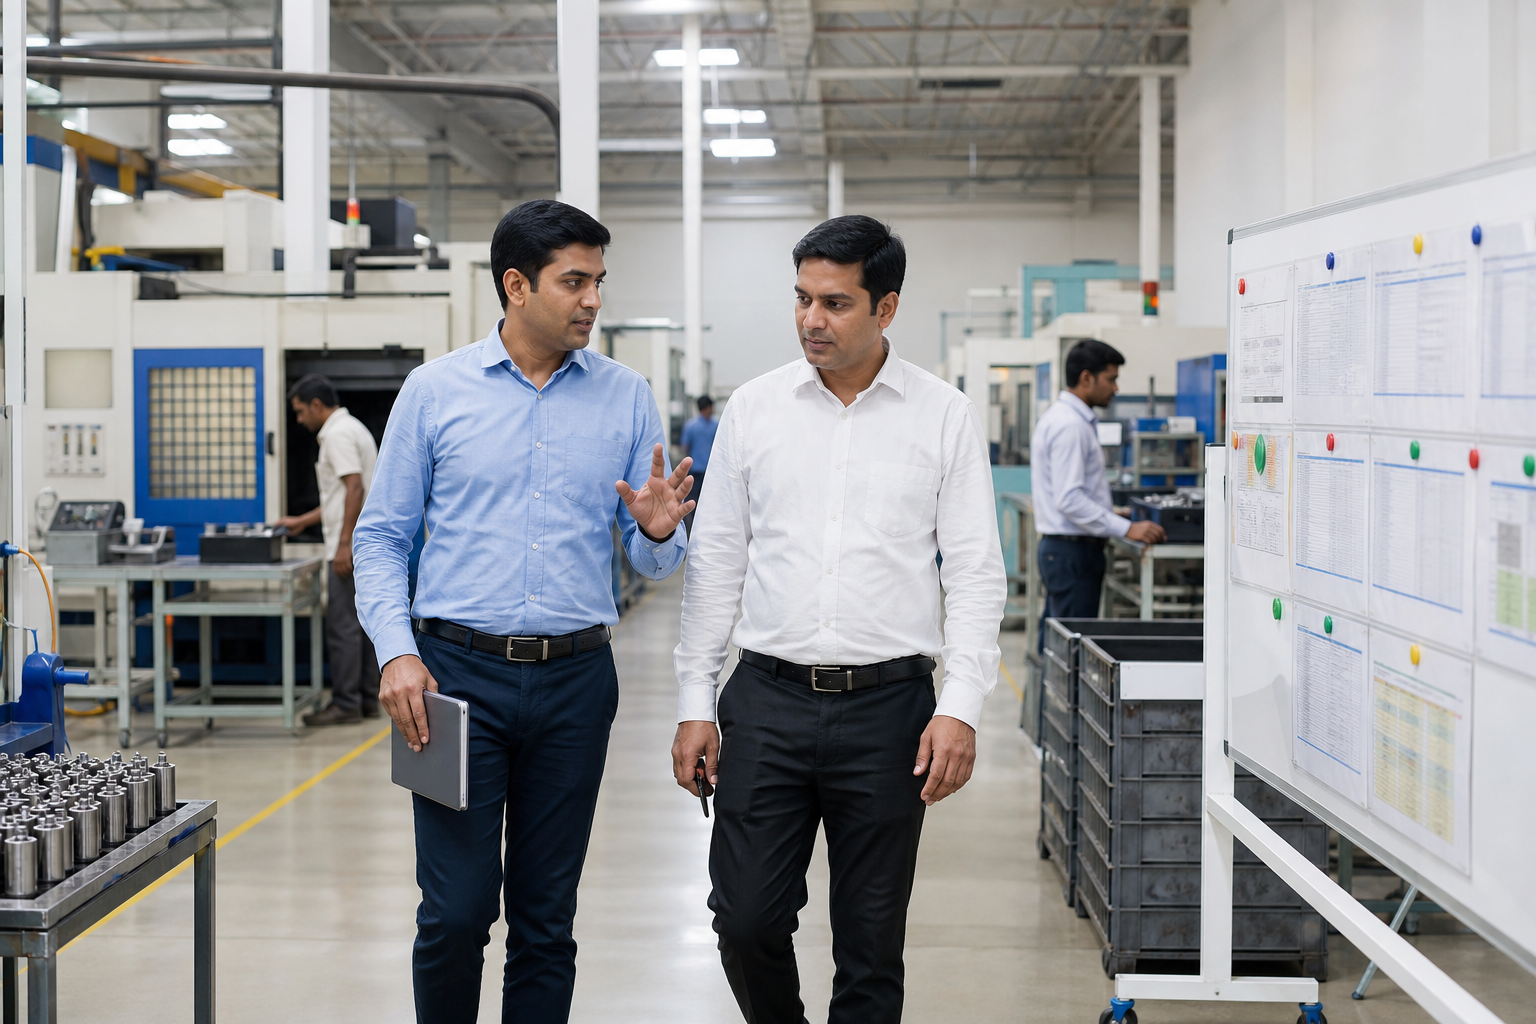
Manufacturing comparison India China discussions usually collapse into one number: FOB price per unit. Importers, distributors, wholesalers, and private-label brands learn quickly that FOB alone mis-ranks suppliers. A lower quote with higher MOQ, longer true lead time, weaker sample discipline, or hidden tooling charges can cost more over a season than a slightly higher FOB from a factory that ships on time with acceptable defect rates.
This article is the operational counterpart to the strategic pillar India vs China for sourcing: which country is better for international buyers?. Where that guide helps you decide whether India, China, or dual-origin fits your category and operating model, this guide compares how manufacturing behaves in each origin across four dimensions buyers feel in daily procurement: cost, quality, MOQ, and lead time. We organize the analysis in the 4-Dimension Manufacturing Comparison Matrix—one framework, four lenses, same frozen spec.
China often wins on scale economics and ecosystem speed for high-volume, component-dense products. India often wins on MOQ flexibility, English coordination, and category depth in textiles, leather, brass, handicrafts, and selected industrial goods—but individual factory performance always matters more than country averages. Altus Exports supports international buyers with on-ground India manufacturing coordination—manufacturer search, sampling follow-up, QC arrangements, and merchant-export handoffs—not as a China sourcing office.
Why manufacturing comparison must start with the same spec
- Product drawings, dimensions, materials, finishes, and performance requirements
- Packaging levels (primary, master carton, labeling intent)
- Target markets and any compliance themes the buyer owns
- Inspection criteria and approved sample reference
- Intended order rhythm (trial quantity, reorder band, seasonality)
- Incoterm basis for quotes (typically FOB port or EXW with named location)
Before you compare India vs China manufacturing on cost, quality, MOQ, or lead time, freeze what you are buying. A spec packet should include:
Without alignment, factories optimize different assumptions. One quotes thin material to hit price; another quotes export-grade packaging you did not request. Manufacturing comparison India China only works when RFQs are comparable.
Link back to origin strategy when results surprise you: China–India sourcing strategy and India vs China for SME buyers for operating-model context.
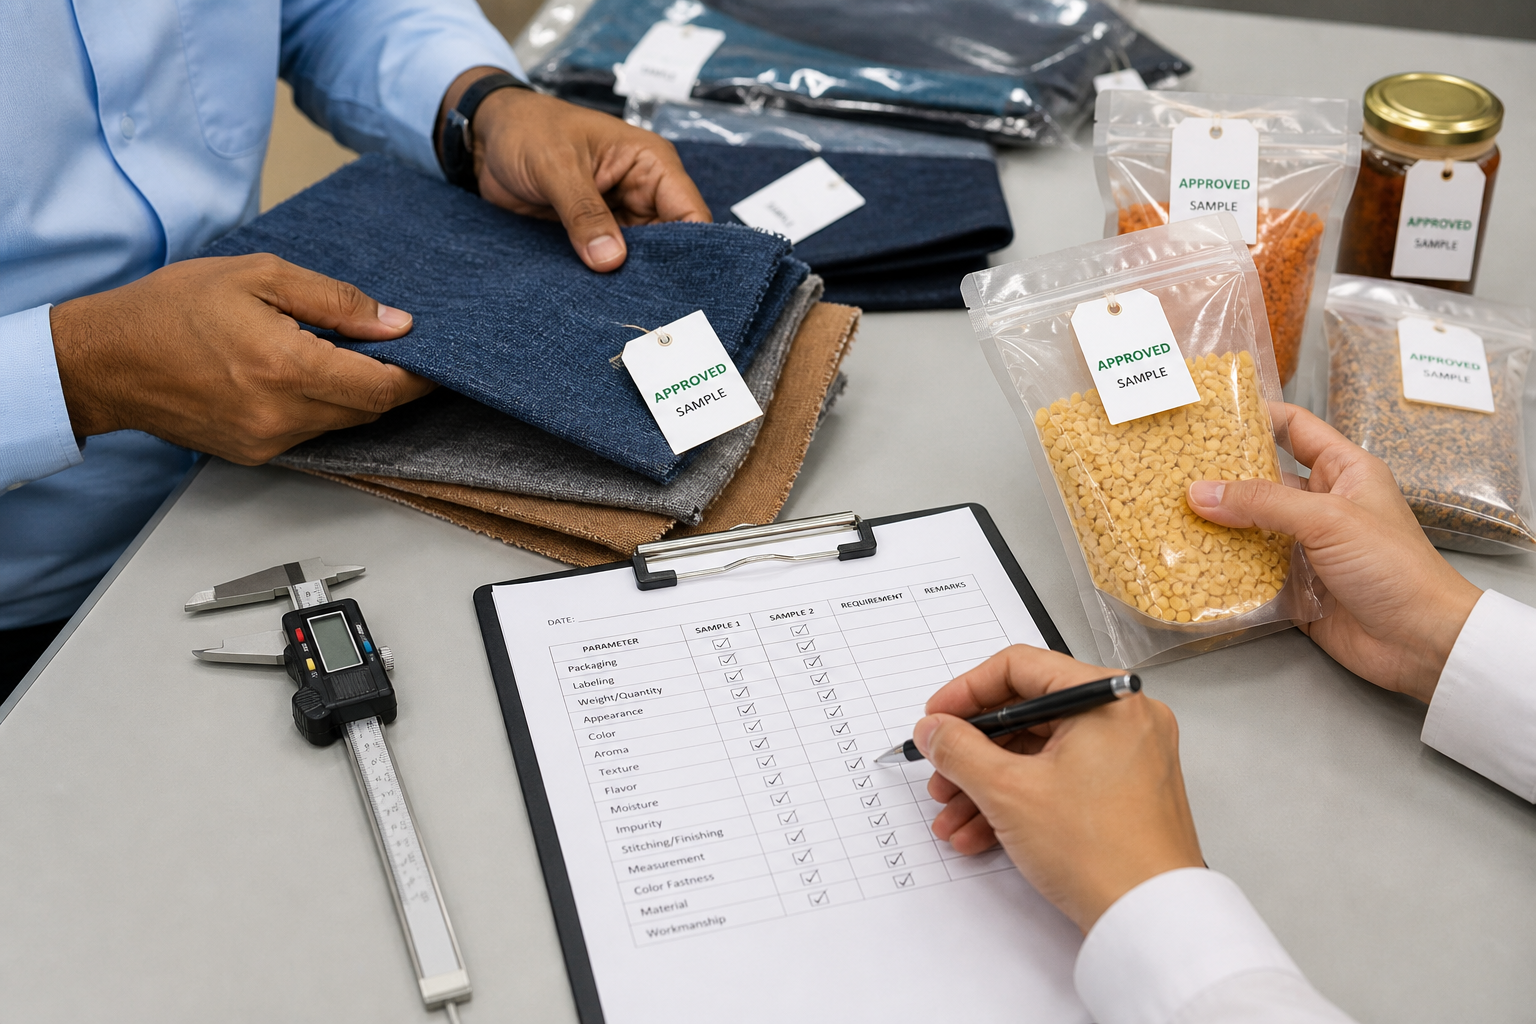
The 4-Dimension Manufacturing Comparison Matrix
Use one matrix row per qualified supplier per origin. Rate and note evidence—not gut feel after a polished sales call.
Comparison table
Swipe →
Data table — swipe horizontally on small screens
| Dimension | What to compare | Primary evidence |
|---|---|---|
| Cost | Unit price, tooling, samples, payment terms, rework risk | Written quote, cost breakdown, pilot PPV |
| Quality | Process control, sample fidelity, inspection access, defect history | Audit, PPS, PSI results, CAPA response |
| MOQ | Minimum order, price breaks, mix rules, packaging multiples | Quote sheet, trial path, reorder MOQ |
| Lead time | Sample cycles, production days, export doc readiness | Milestone plan, past shipment references |
Matrix scoring guide (internal use)
Comparison table
Swipe →
Data table — swipe horizontally on small screens
| Rating | Cost | Quality | MOQ | Lead time |
|---|---|---|---|---|
| Strong | Transparent breakdown; stable reorder | PPS matches bulk; inspection welcomed | Trial path realistic for your volume | Milestones documented; references check out |
| Adequate | Some opaque lines; manageable | Minor PPS deltas; fixable with spec | MOQ high but negotiable with plan | Slippage risk; buffer needed |
| Weak | Hidden tooling/pack surprises | PPS drift; audit gaps | MOQ misaligned with cash/volume | Vague dates; doc delays likely |
Do not average scores into a single "winner." Leadership decisions need visible trade-offs: "China Factory A wins cost and lead time at 10k MOQ; India Factory B wins MOQ and quality access at 2k with +12 days production."
Dimension 1 — Manufacturing cost: beyond the FOB line item
Manufacturing cost includes everything that affects cash and margin before goods reach your warehouse—not only factory unit price.
What sits in the cost stack
Comparison table
Swipe →
Data table — swipe horizontally on small screens
| Cost element | Typically in FOB quote? | China — common pattern | India — common pattern | Buyer implication |
|---|---|---|---|---|
| Unit FOB / EXW price | Yes | Aggressive at high volume | Competitive in category clusters; varies by SKU | Compare at same spec and pack level |
| Tooling / molds / dies | Sometimes separate | Amortized expectations at scale | Often quoted explicitly for custom work | Capture ownership and replacement terms |
| Sample charges | Separate | May credit against PO | Often separate; negotiate early | Budget sample cycles in both origins |
| Packaging / printing setup | Sometimes | Mature print ecosystem | Strong in clusters; lead time varies | Freeze dielines before cost lock |
| Payment terms | No | Deposits + balance before ship common | Similar patterns; verify who holds goods | Model cash flow, not only FOB |
| Rework / scrap risk | No | Low when process mature | Low when factory matched; higher if misfit | Quality failures are cost items |
| Coordination overhead | No | Mandarin support may add cost | English reduces friction for many buyers | Include management time |
China often delivers lower unit cost on high-volume, standardized SKUs where lines are utilized, components are local, and exporters run similar products daily. India can deliver competitive total program cost when moderate volumes, customization, or category fit reduce development loops, air-freight rescue shipments, or management churn—even if FOB is not the lowest line on a spreadsheet.
This article does not build a full tariff and duty line-item model. For freight, duty, insurance, and landed-cost methodology, use India vs China sourcing costs and landed cost comparison. Here the focus stays on factory-side and program-side cost drivers buyers control during supplier selection.
Cost comparison scenarios
Comparison table
Swipe →
Data table — swipe horizontally on small screens
| Factor | China tendency | India tendency | Buyer implication |
|---|---|---|---|
| Category depth | Production pockets exist | Cluster heritage and variety | India often preferred for craft/custom |
| Unit cost | Varies by process | Competitive where clusters export daily | Compare spec-matched quotes only |
| Quality cost | Rework expensive if wrong factory | Same | Audit and PPS non-negotiable |
#### Scenario A — High-volume standardized hard good (10,000+ units / SKU / order)
#### Scenario B — Moderate-volume customized SKU (2,000–5,000 units)
#### Scenario C — Textile / leather / brass / handicraft program
Hidden cost traps (both origins)
- Unstable specs after PO: engineering changes mid-production destroy cost models in either country.
- Packaging approved late: goods sit finished while cartons or labels catch up—storage, cash, and missed launch windows.
- Payment before verification: balance released without PSI or agreed acceptance exposes rework cost.
- Trading company opacity: margin stacked without clear factory accountability.
- MOQ over-order: buying units to hit price breaks without sell-through turns FOB "savings" into inventory cost.
SME buyers should cross-read India vs China for SME buyers for cash and volume realism without duplicating a full SME treasury guide here.
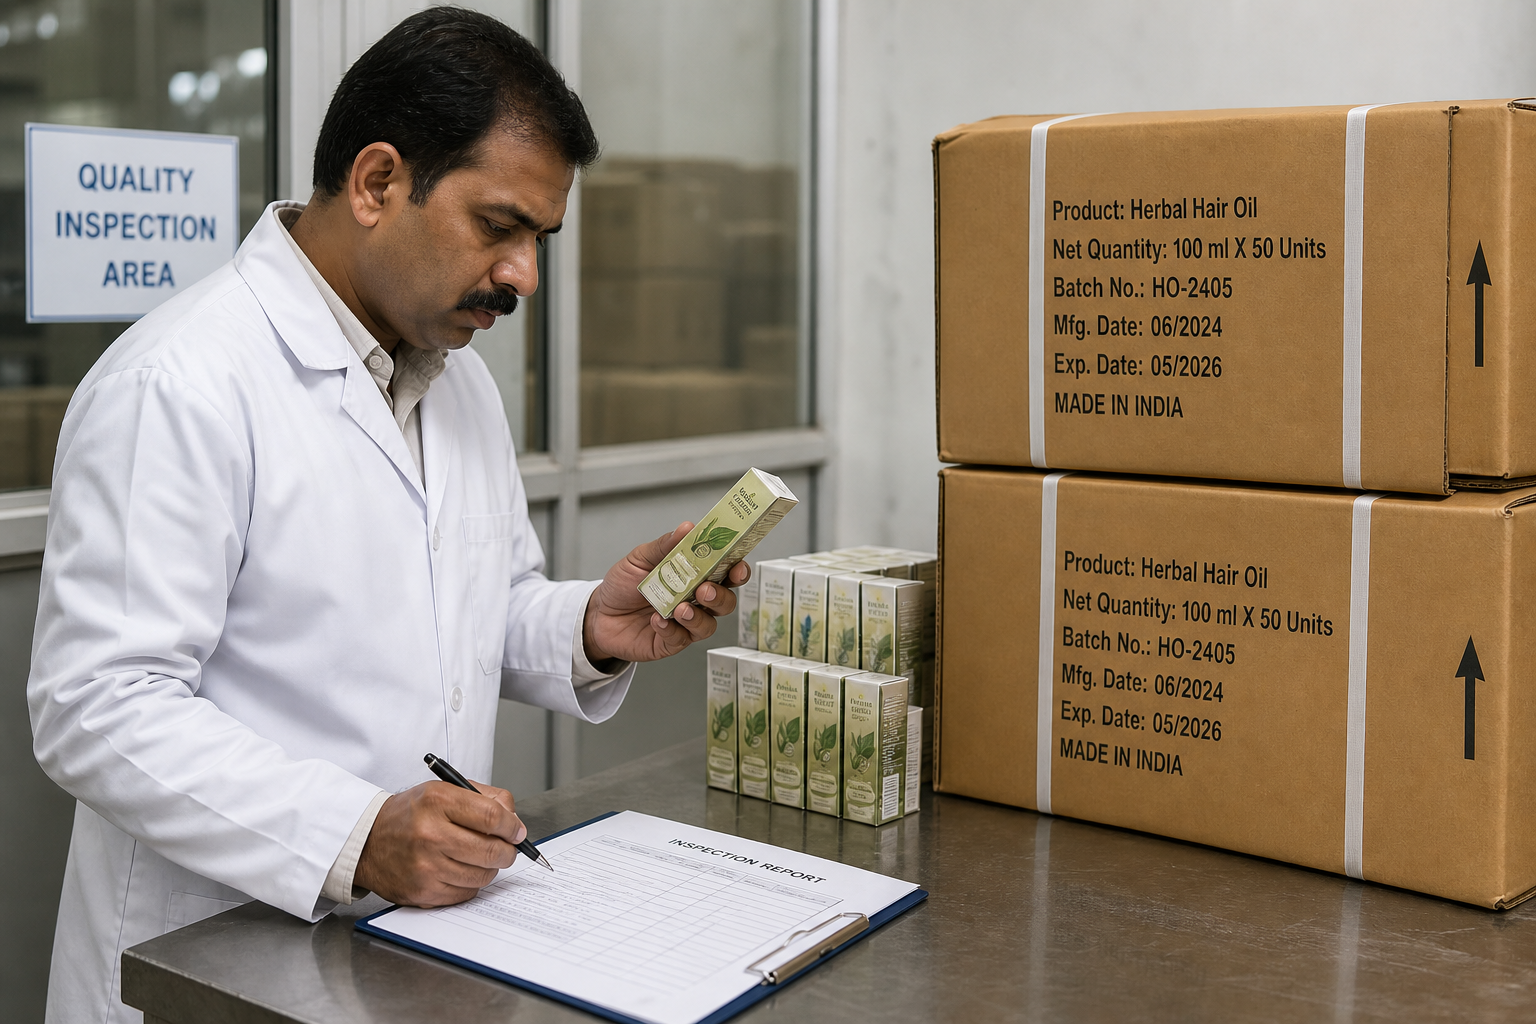
Dimension 2 — Quality: factory process beats country labels
Quality in India vs China manufacturing is not a citizenship score. It is the result of factory process control, spec clarity, material discipline, and whether the buyer can audit and inspect.
Quality system comparison at manufacturing level
Comparison table
Swipe →
Data table — swipe horizontally on small screens
| Quality element | China — typical export factory | India — typical export factory | Buyer implication |
|---|---|---|---|
| Spec adherence | Strong when SKU is core line | Strong when SKU is core line | Match factory to product type |
| Sample fidelity (PPS → bulk) | Usually disciplined in mature plants | Same when export-oriented | Document approved sample + revision log |
| Inline inspection access | Often granted with notice | Often granted with notice | Write inspection rights into PO |
| Third-party PSI | Mature inspector network | Growing network in hubs | Book early in peak season |
| Audit depth (social, technical) | Large audit industry | Audits available; verify firm | Use same checklist both origins |
| CAPA response | Varies | Varies | Test with sample issues before PO |
China’s export manufacturing base includes many factories with years of repeatable QC rhythms for high-volume SKUs. India’s export base includes category specialists with excellent process control—and generalists who should not receive your order. Verification and inspection are origin-agnostic requirements.
Deep audit playbook: India vs China quality control, factory audits, and supplier risk.
Quality gates buyers should run (either origin)
Comparison table
Swipe →
Data table — swipe horizontally on small screens
| Gate skipped | Common failure mode | Cost impact |
|---|---|---|
| Verification | Wrong entity or subcontract surprise | Total loss risk |
| PPS approval | Bulk drift on color, dimensions, pack | Rework, markdowns, returns |
| PSI | Defects discovered at destination | Chargebacks, reputation damage |
- Factory verification — entity, export orientation, category references.
- Capability review — machinery, in-house vs outsourced steps, capacity band.
- Development sample — fit, finish, function, pack mock-up.
- Pre-production sample (PPS) — frozen spec reference for bulk.
- Inline check (when risk warrants) — materials, critical dimensions, pack line.
- Pre-shipment inspection (PSI) — AQL or agreed criteria before balance payment.
Quality narrative: when buyers perceive "China quality" vs "India quality"
- Mismatch between factory core competency and ordered SKU
- Spec gaps filled by factory assumptions
- Packaging/label errors treated as product quality issues
- Comparison of mature China line vs first Indian pilot without fair pilot design
Buyers sometimes say "China quality is better" or "India quality is inconsistent." Underneath those statements are usually:
Fair comparison requires the same gates, same inspectors where possible, and same acceptance criteria. Origin strategy context: India vs China for sourcing international buyers.
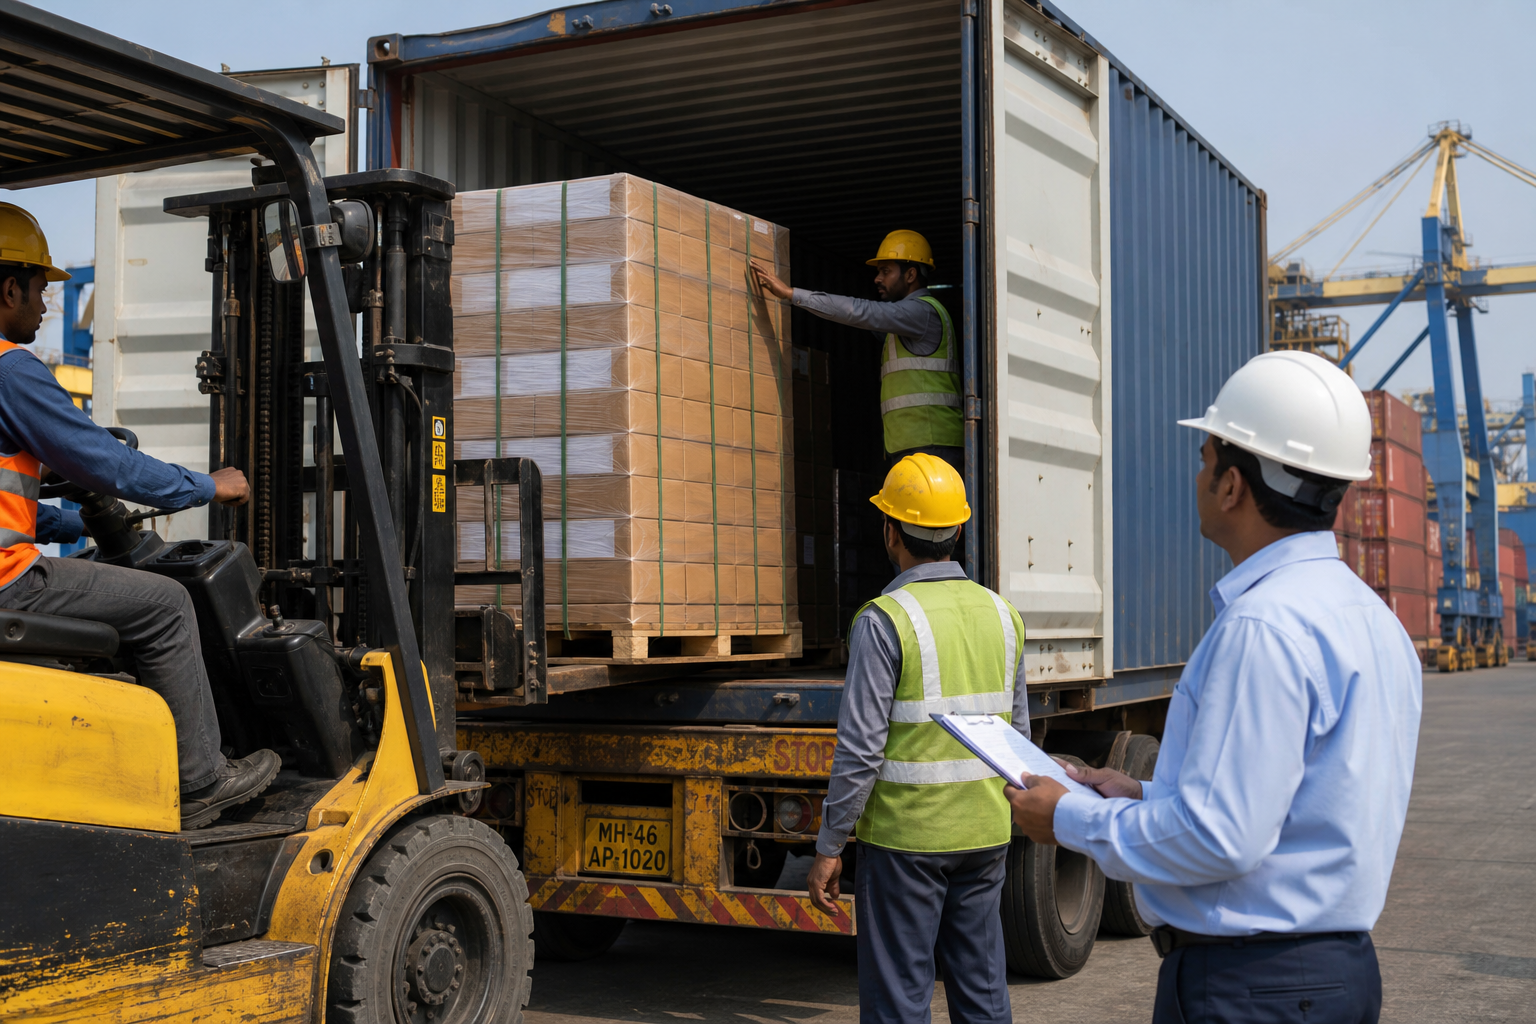
Dimension 3 — MOQ: minimum order economics shape who can play
MOQ (minimum order quantity) is a manufacturing constraint, a cash constraint, and a negotiation outcome. India vs China MOQ behavior differs by category and factory tier more than by flag.
MOQ drivers
Comparison table
Swipe →
Data table — swipe horizontally on small screens
| Driver | Effect on MOQ |
|---|---|
| Setup / changeover time | Longer setups push MOQ up |
| Material purchase minimums | Fabric, metal, chemicals bought in bulk MOQs |
| Print / tooling amortization | Custom pack or mold costs spread over units |
| Factory tier | Large tier-1 plants vs niche OEM shops |
| Season / capacity | Peak seasons raise effective MOQ |
| Trading company layer | Trader may inflate MOQ vs factory floor |
India vs China MOQ — tendency table (not rules)
Comparison table
Swipe →
Data table — swipe horizontally on small screens
| Situation | China tendency | India tendency | Buyer implication |
|---|---|---|---|
| High-volume commodity hard good | Lower MOQ per unit cost curve | Higher unless matched plant | China often wins MOQ/cost combo |
| Custom OEM / private label | MOQ tied to tooling and pack | Flexible pilots in cluster OEMs | India often in play for moderate MOQ |
| Textiles / apparel | Volume-driven | MOQ varies by fabric MOQ | Plan fabric commitment |
| Handicrafts / brass / decor | MOQ from consolidated workshops | Wide range; small batch possible | India often supports assortment |
| Reorder vs first order | Reorder MOQ may drop | Same if relationship proven | Negotiate trial and reorder bands |
MOQ negotiation tactics that work in both countries
- Ask for trial quantity with explicit path to reorder MOQ and price breaks.
- Separate tooling/pack setup from unit MOQ so cash is visible.
- Offer assortment MOQ (mix of SKUs) when single-SKU MOQ is too high.
- Align MOQ with real sell-through—inventory is MOQ failure mode.
- Document reorder terms in writing before first PO.
Private-label MOQ dynamics overlap with India vs China for private label products. India execution support: private label manufacturing in India.
MOQ red flags
Comparison table
Swipe →
Data table — swipe horizontally on small screens
| Red flag | Why it matters |
|---|---|
| MOQ drops dramatically without explanation | Possible quality or material substitution risk |
| No trial path offered | Locked into inventory before validation |
| MOQ quoted without pack multiple | Shipping and warehouse chaos |
| Trader cannot state factory MOQ | Accountability gap |
Dimension 4 — Lead times: sample cycles, production, and export readiness
Lead time is the calendar from brief to goods ready for consignment—or to arrival if you model logistics separately. Buyers underestimate sample cycles and document readiness as often as production days.
Lead time stack
Comparison table
Swipe →
Data table — swipe horizontally on small screens
| Phase | Typical buyer underestimate | What to document |
|---|---|---|
| RFQ + shortlist | "Quotes in a week" | Comparable spec sent to all |
| Development samples | One round | Plan two to three revision cycles |
| PPS approval | Instant | Pack and labeling included |
| Raw material procurement | Ignored | Fabric, metal, imported components |
| Production | Factory stated days | Start date after PPS sign-off |
| QC / PSI | Same day | Inspector booking lead |
| Export documents | Automatic | Invoice, packing list, certs, COO if needed |
India vs China lead time — tendency table
Comparison table
Swipe →
Data table — swipe horizontally on small screens
| Phase | China tendency | India tendency | Buyer implication |
|---|---|---|---|
| Development sampling | Fast when catalog/OEM base exists | Fast in cluster OEMs; slower if misfit | Match factory to SKU |
| Component sourcing | Often local for electronics/hard goods | Strong local in category clusters | BOM local content affects schedule |
| Production (repeat SKU) | Often shorter at scale | Competitive when line dedicated | Repeat orders compress time |
| Production (new SKU) | Engineering + tooling time | Similar | Do not use repeat SKU benchmarks |
| Peak season (Q3/Q4 pressure) | Congestion before CNY / peak export | Congestion before festival seasons | Book slots early |
| Export readiness | Mature export desks common | Mature in export factories | Verify who owns doc chase |
China often shows shorter production lead times for high-volume repeat SKUs with local component supply. India often shows competitive lead times when the factory is category-core and materials are locally sourced—textiles, brass, leather, many engineered parts from established exporters.
Lead time comparisons fail when buyers compare a Chinese repeat order to an Indian first development. Pilot fairly: first order to first order, repeat to repeat.
Lead time risk buffers (practical ranges, not guarantees)
Comparison table
Swipe →
Data table — swipe horizontally on small screens
| SKU complexity | Sample + approval buffer | Production buffer (after PPS) | Notes |
|---|---|---|---|
| Simple off-shelf adaptation | 2–4 weeks | Add 1–2 weeks to factory quote | Pack approval often critical path |
| Moderate custom OEM | 4–8 weeks | Add 2–3 weeks to factory quote | Tooling parallel where possible |
| Complex multi-component | 8–12+ weeks | Add 3–4 weeks to factory quote | Component sourcing dominates |
Buyers should plan buffers based on SKU complexity—not blog averages.
Export lane and destination customs sit outside factory lead time. Regional export comparison: India vs China exporting to USA, Europe, and Middle East.

Combined matrix: side-by-side manufacturing profile
Use this summary when presenting to leadership after RFQs and samples—not before.
Merchant-export coordination can consolidate multi-SKU follow-up for buyers without India staff: merchant exporter in India and import products from India.
Comparison table
Swipe →
Data table — swipe horizontally on small screens
| Profile | Cost | Quality | MOQ | Lead time | Typical buyer fit |
|---|---|---|---|---|---|
| China scale manufacturer | Strong at high volume | Strong on core lines | Lower at volume | Short on repeat SKUs | High-volume importers, hard goods |
| China niche OEM | Moderate | Good if matched | Medium | Medium | Custom programs with China ecosystem need |
| India cluster OEM | Competitive in category | Good when specialist | Moderate–flexible | Medium | Textile, leather, brass, PL brands |
| India merchant-export coordinated | Transparent with partner | QC gates essential | Flexible multi-SKU | Medium + doc clarity | SMEs, multi-SKU containers |

Worked comparison: how to run one SKU through the matrix
Example (illustrative, not a quote): Branded cotton tote bag program, 5,000 units, two-color screen print, export carton labeling for US retail.
Numbers are placeholders to show method, not market facts. Your RFQs must replace hypothetical cells.
Comparison table
Swipe →
Data table — swipe horizontally on small screens
| Dimension | Qualified China factory (hypothetical) | Qualified India factory (hypothetical) | Notes |
|---|---|---|---|
| Cost | Lower FOB at 10k; at 5k, slightly higher | Competitive FOB at 5k with local textile chain | Compare at 5k with same gsm and handles |
| Quality | Strong if bag is daily export line | Strong if Tirupur/Kolkata-tier textile exporter | Request PPS with load test stitch spec |
| MOQ | 10k price break; 5k accepted with premium | 3k–5k native MOQ common | India may win effective MOQ band |
| Lead time | 25–30 days production after PPS | 28–35 days production after PPS | Sample rounds may differ more than production |
| Buyer decision | Choose China if scaling to 10k+ quickly | Choose India if 5k reorders and diversification matter | Run parallel samples |
Manufacturing comparison by buyer type
Importer / wholesaler
Prioritize reorder lead time, MOQ vs sell-through, and defect rate at PSI. Cost matters, but stockouts and returns destroy margin. Use the matrix on top three SKUs by revenue.
Retail private label
Prioritize PPS fidelity, pack print lead time, and MOQ trial path. A one-week production delay hurts less than launching with wrong barcodes. See India vs China for private label products.
Procurement manager under dual-source policy
Run the matrix per origin for the same SKU during pilot phase. Shared QC standards make results comparable. Strategy hub: China–India sourcing strategy. Diversification: India vs China supply chain diversification.
SME / first-time manufacturer buyer
Prioritize MOQ flexibility, English coordination, and partner support if internal bandwidth is thin. Manufacturing comparison without operating capacity produces fantasy supplier lists. India vs China for SME buyers.

From matrix results to PO: execution checklist
Checklist
- Award only after PPS approval and documented MOQ/lead time milestones.
- PO includes spec attachment, inspection rights, pack standards, penalty/bonus only if enforceable and agreed.
- Production calendar starts at PPS sign-off, not PO date.
- QC booked before production completes—inspectors slip in peak season.
- Export docs owner named (factory, partner, or buyer agent).
- Reorder uses matrix again if volume band changes—MOQ and lead time are not static.
India on-ground coordination: find manufacturers in India, product sourcing company in India, global sourcing partner in India.

Conclusion
India vs China manufacturing comparison is operational, not ideological. The 4-Dimension Manufacturing Comparison Matrix—cost, quality, MOQ, and lead time—lets importers, distributors, wholesalers, and private-label brands compare qualified suppliers on the dimensions that affect cash, launches, and reorder stability. China often leads on scale-driven unit cost and repeat-SKU speed when ecosystems align. India often competes on MOQ flexibility, category depth, and coordination advantages in textiles, leather, brass, handicrafts, and many OEM programs—without guaranteeing lower price in every SKU.
Run the matrix on frozen specs, parallel samples where feasible, and shared QC gates. Pair this article with the strategic pillar India vs China for sourcing international buyers, landed-cost depth in India vs China sourcing costs and landed cost comparison, and audit discipline in India vs China quality control, factory audits, and supplier risk. When India manufacturing fits your matrix results, Altus Exports can support on-ground coordination—manufacturer search, sampling follow-up, QC arrangements, and merchant-export handoffs—while you retain commercial and compliance decisions.