
How to Calculate the Total Cost of Buying Products From India
By Saurabh Mittal, Founder, Altus Exports
To calculate the total cost of buying products from India, start with landed cost (product, freight, insurance, duties, and destination fees), then add pre-shipment costs such as sampling, supplier verification, QC inspections, sourcing partner fees, payment and FX costs,…

Most import cost discussions stop at landed cost—the price of goods plus freight, insurance, duties, and clearance to your door. That number is essential. It is also incomplete.
International buyers sourcing from India often discover that a supplier with the lowest FOB quote is not the lowest-cost option once sampling cycles, inspection fees, payment terms, quality failures, and internal procurement time are counted. A product that clears customs at an attractive per-unit landed cost can still fail commercially if defect rates, compliance testing, or working capital tie up margin for months.
The total cost of buying from India—sometimes called total cost of ownership (TCO) in a procurement context—includes every cost required to get usable, sellable inventory into your warehouse and keep it moving through your channel. It extends beyond the classic landed-cost worksheet covered in how to calculate landed cost of products imported from India.
Why FOB price and landed cost are not enough
This article introduces the India Buying TCO Model (IBTCO-10): ten cost layers international buyers should model when comparing Indian suppliers, building import budgets, or deciding whether to use a sourcing partner. The model is designed for importers, distributors, retailers, and private-label brands that need a realistic economic view—not a quote-stage illusion.
Altus Exports supports buyers who need both commercial comparison and import execution visibility. Whether you calculate TCO internally or with a partner, the discipline is the same: make cost assumptions explicit before you commit production capacity and purchase orders.
FOB (Free on Board) tells you what the supplier charges for goods loaded at the Indian port, subject to your agreed Incoterm. Landed cost adds international logistics, insurance, import duties, taxes, and destination charges to reach your warehouse or fulfillment node. Both are necessary. Neither captures the full economics of buying from India.
Buyers routinely underestimate costs that occur before shipment, after arrival, or across the relationship:
A supplier that quotes $4.20 FOB may look cheaper than one at $4.50 FOB. If the first supplier requires three sample rounds, fails a pre-shipment inspection, ships with packaging that triggers rework, and offers 100% advance payment while the second accepts balanced milestones with lower defect history, the cheaper FOB supplier can produce a higher TCO per sellable unit.
For Incoterm context that affects which line items sit in landed cost versus supplier scope, see FOB vs CIF vs EXW when buying from India.
Comparison table
Swipe →
Data table — swipe horizontally on small screens
| Cost category | Often visible in FOB quote? | Often visible in landed cost? | Typically missed without TCO |
|---|---|---|---|
| Product unit price | Yes | Yes | — |
| Ocean or air freight | Partial (depends on Incoterm) | Yes | — |
| Import duty and VAT/GST | No | Yes | — |
| Customs brokerage | No | Yes | — |
| Sample development and revisions | No | No | Yes |
| Factory audit or verification travel | No | No | Yes |
| Pre-shipment inspection (PSI) | No | No | Yes |
| Sourcing partner or agent fees | No | No | Yes |
| Letter of credit or advance financing | No | No | Yes |
| FX spread and remittance fees | No | No | Yes |
| Inventory holding and storage | No | Partial | Yes |
| Defects, returns, rework, write-offs | No | No | Yes |
| Buyer procurement and QC time | No | No | Yes |
| Destination compliance testing (FDA, CE, etc.) | No | No | Yes |

Introducing the IBTCO-10 model
The India Buying TCO Model (IBTCO-10) organizes total cost into ten layers. Layers 1–3 cover direct product and logistics economics. Layers 4–10 cover the costs that separate a workable import program from a quote that looked good on paper.
Each layer can be expressed as a total project cost and allocated across expected units. The goal is not false precision—it is to compare suppliers and sourcing paths on a consistent basis.
Comparison table
Swipe →
Data table — swipe horizontally on small screens
| Layer | IBTCO-10 component | Primary question it answers |
|---|---|---|
| 1 | Landed cost per unit | What does each unit cost at my warehouse after freight, duty, and clearance? |
| 2 | Sampling and product development | What did we spend to reach an approved production specification? |
| 3 | Supplier verification, travel, and audit | What did we invest to confirm the supplier is real, capable, and aligned? |
| 4 | Quality control and inspection | What do inspections, audits, and monitoring cost per order or per unit? |
| 5 | Sourcing partner and coordination fees | What do local sourcing, procurement, or export coordination services add? |
| 6 | Payment financing, FX, and banking | What do payment terms, currency conversion, and instruments cost? |
| 7 | Inventory holding and working capital | What does capital tied up in production, transit, and storage cost? |
| 8 | Defect, return, and failure costs | What is the expected cost of quality failures and commercial fallout? |
| 9 | Buyer time and internal procurement cost | What does my team's time add in fully loaded terms? |
| 10 | Compliance testing and market certification | What testing or certification is required before or after I can sell? |
Layer 1: Landed cost—the foundation (not the finish line)
- product cost under your agreed Incoterm (often FOB or EXW factory price, depending on contract);
- inland transport in India to port or airport, if not already in the supplier quote;
- international freight (ocean FCL/LCL or air);
- cargo insurance where applicable;
- import duties, tariffs, and antidumping or safeguard charges where applicable;
- destination VAT, GST, or sales tax where applicable;
- customs brokerage, port or airport handling, and delivery to warehouse;
- any mandatory destination fees not included in freight.
Landed cost is the base of IBTCO-10. It typically includes:
Use the landed-cost formula and worksheet in how to calculate landed cost of products imported from India rather than rebuilding every line item here. Pair that worksheet with how import duties and taxes work when buying from India for classification and duty assumptions.
Important boundary: landed cost tells you what cleared inventory cost per unit at arrival. It does not amortize sampling, inspection, or quality failures across your purchase—those belong in later IBTCO-10 layers.
Quick landed cost allocation rule
For TCO modeling, express landed cost as:
Landed cost per unit = (Total landed shipment cost) ÷ (Sellable units received)
Use sellable units—not ordered units—if you already expect a known yield loss. If yield is uncertain, model base landed cost on ordered units and address failure separately in Layer 8.
Layer 2: Sampling and product development costs
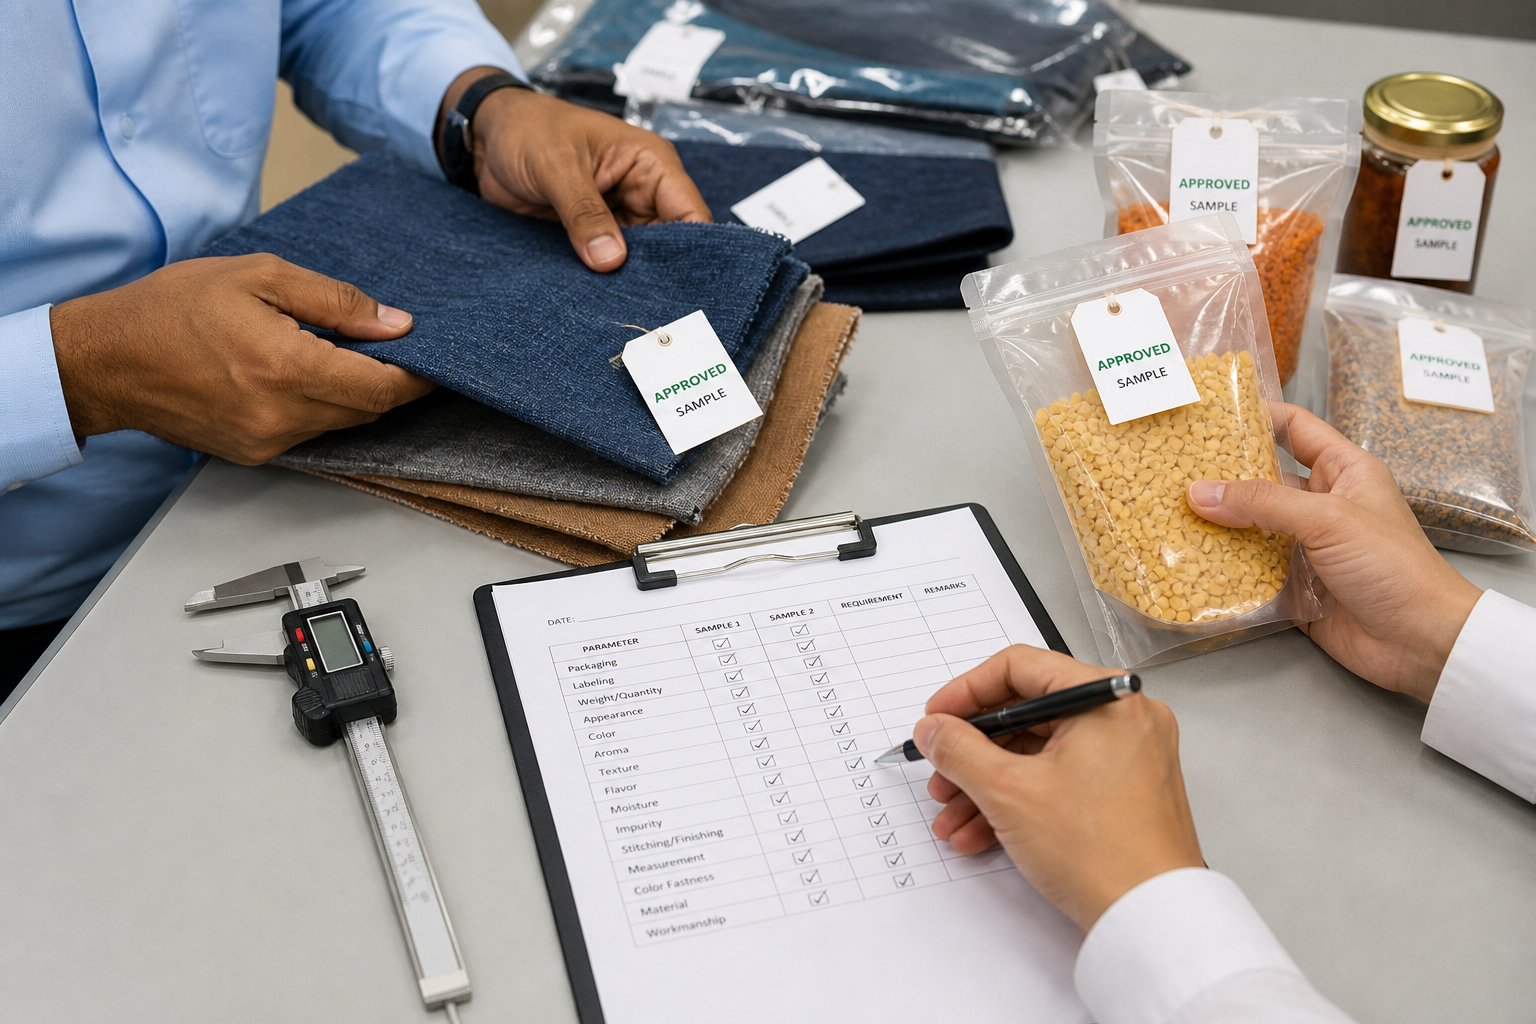
Before production, buyers typically run sample cycles—initial, revised, pre-production, packaging mock-ups, and sometimes tooling samples. Capture factory sample charges, mold deposits, courier freight (often with destination duty), lab tests on materials, and re-sample costs when specs change.
New suppliers often need two to four rounds. On a 5,000-unit first order, $1,200 in sampling and courier adds $0.24 per unit when amortized. Budget sampling as development, not a one-off surprise. See verify product quality before buying from an Indian manufacturer.
Layer 3: Supplier verification, travel, and audit costs
Verification covers document checks (registration, GSTIN, IEC), third-party audit reports, virtual or on-site factory visits, and supplier scorecards. Partner-led audits typically run from hundreds to several thousand dollars depending on depth.
Amortize across expected relationship volume, not only the first PO: $3,000 on a 1,000-unit trial adds $3.00 per unit; spread over 50,000 units across three years, it adds $0.06. See verify an Indian supplier before order, supplier due diligence, and remote supplier audit.
Layer 4: Quality control and inspection costs
- incoming or pre-production inspections;
- during-production monitoring (DUPRO) for higher-risk orders;
- pre-shipment inspection (PSI) before cargo release;
- third-party inspection agency fees (per man-day or per order);
- laboratory testing for safety, performance, or material compliance;
- rework coordination or sorting at origin when defects are found late;
- chargebacks or concessions when defects reach your warehouse.
QC spending is one of the most under-modeled TCO layers—and one of the most controllable. Costs include:
Inspection is not always required on every order, but skipping it on high-risk categories (children's products, food-contact goods, electronics, structural items) often shifts cost from Layer 4 to Layer 8 in the form of failures.
Build an inspection plan tied to product risk. Reference how to conduct quality control when sourcing from India, pre-shipment inspection in India, and third-party quality inspection in India.
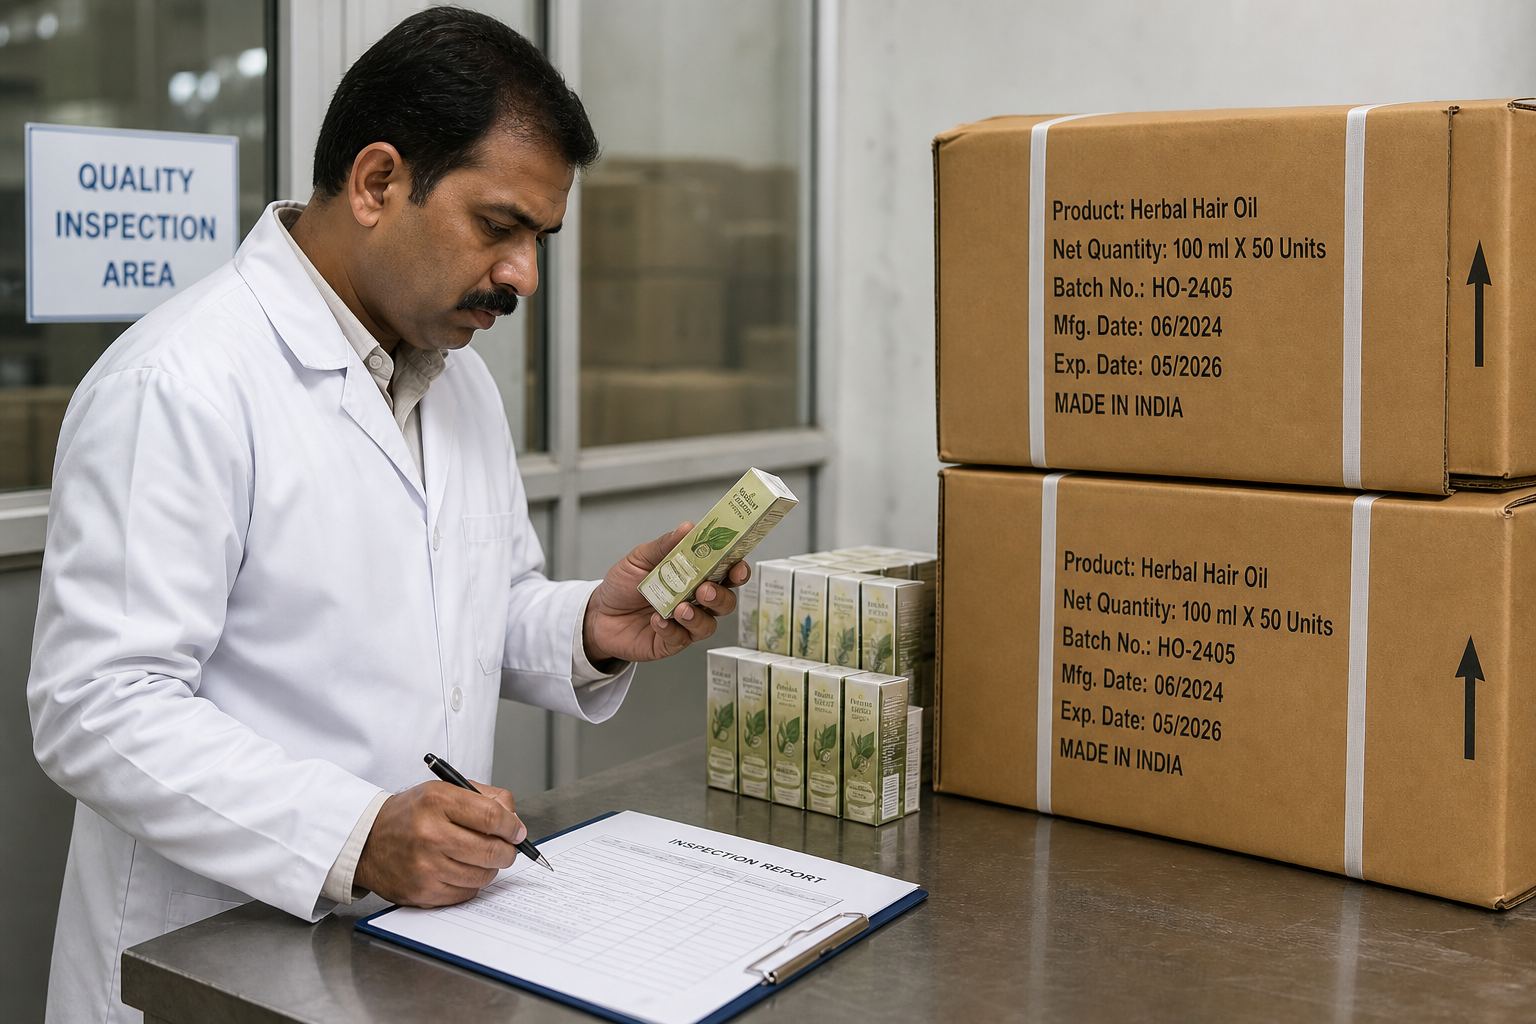
Example allocation: A $450 PSI on a 10,000-unit order adds $0.045 per unit—often less than the cost of a 2% defect rate on a $6 landed-cost item ($0.12 per unit in scrapped value alone).
Layer 5: Sourcing partner and coordination fees
Not every buyer uses a sourcing partner, merchant exporter, or India procurement company. When you do, fees belong in TCO—not hidden inside unit price without analysis.
Common fee models:
A low partner service fee can still deliver lower TCO if the partner reduces rework, shortens sample cycles, or prevents a documentation error that delays customs. Conversely, a "free sourcing" commission model can inflate unit cost if factory prices are marked up.
Evaluate partner economics alongside how to find a reliable sourcing partner in India and Altus Exports services such as global sourcing partner in India and import products from India.
Comparison table
Swipe →
Data table — swipe horizontally on small screens
| Model | How it typically works | TCO treatment |
|---|---|---|
| Fixed project or retainer fee | Monthly or per-SKU sourcing support | Amortize across units sourced in the period |
| Per-order coordination fee | Flat fee per PO or shipment | Add directly to that order's unit economics |
| Commission on FOB | Percentage of factory price | Increases effective product cost; compare transparency vs. bundled margin |
| Merchant exporter margin | Partner buys from factory and sells to you | Compare all-in delivered price against FOB + self-managed import stack |
| Pass-through costs | Travel, inspection, samples billed separately | Capture in Layers 2–4 and avoid double counting |
Layer 6: Payment financing, FX, and banking costs
- advance payment as a percentage of order value (opportunity cost of capital);
- LC opening, amendment, and confirmation fees;
- bank TT or SWIFT charges per remittance;
- FX spread between mid-market rate and bank rate;
- currency hedging costs if you hedge INR exposure;
- cost of payment delay penalties or supplier price uplifts for non-standard terms.
Payment structure affects cash flow and total cost. Indian export transactions commonly use telegraphic transfer (TT) milestones, letters of credit (LC), or combinations with retainers for tooling.
Cost elements:
Payment risk also has economic weight: excessive advance without controls increases loss exposure if production fails. Read how to pay Indian suppliers for milestone design.
Worked example: On a $50,000 order paid 30/70 with two TT transfers, bank fees of $40 per transfer and a 1.2% FX spread on the full value can add roughly $600–$800—about $0.08 per unit on 10,000 pieces. A confirmed LC may cost more in bank fees but reduce supplier non-delivery risk on a new relationship.
Express financing cost as an annualized rate applied to cash tied up between deposit and sale if you want strict TCO rigor. Even a simplified flat fee model is better than ignoring payment economics.
Layer 7: Inventory holding and working capital costs
- deposit and balance payments before shipment;
- production lead time (often 30–90 days depending on category);
- ocean transit (commonly 18–35 days to US East Coast, variable elsewhere);
- customs clearance and inland delivery;
- warehouse storage before sale;
- safety stock buffer for reorder cycles.
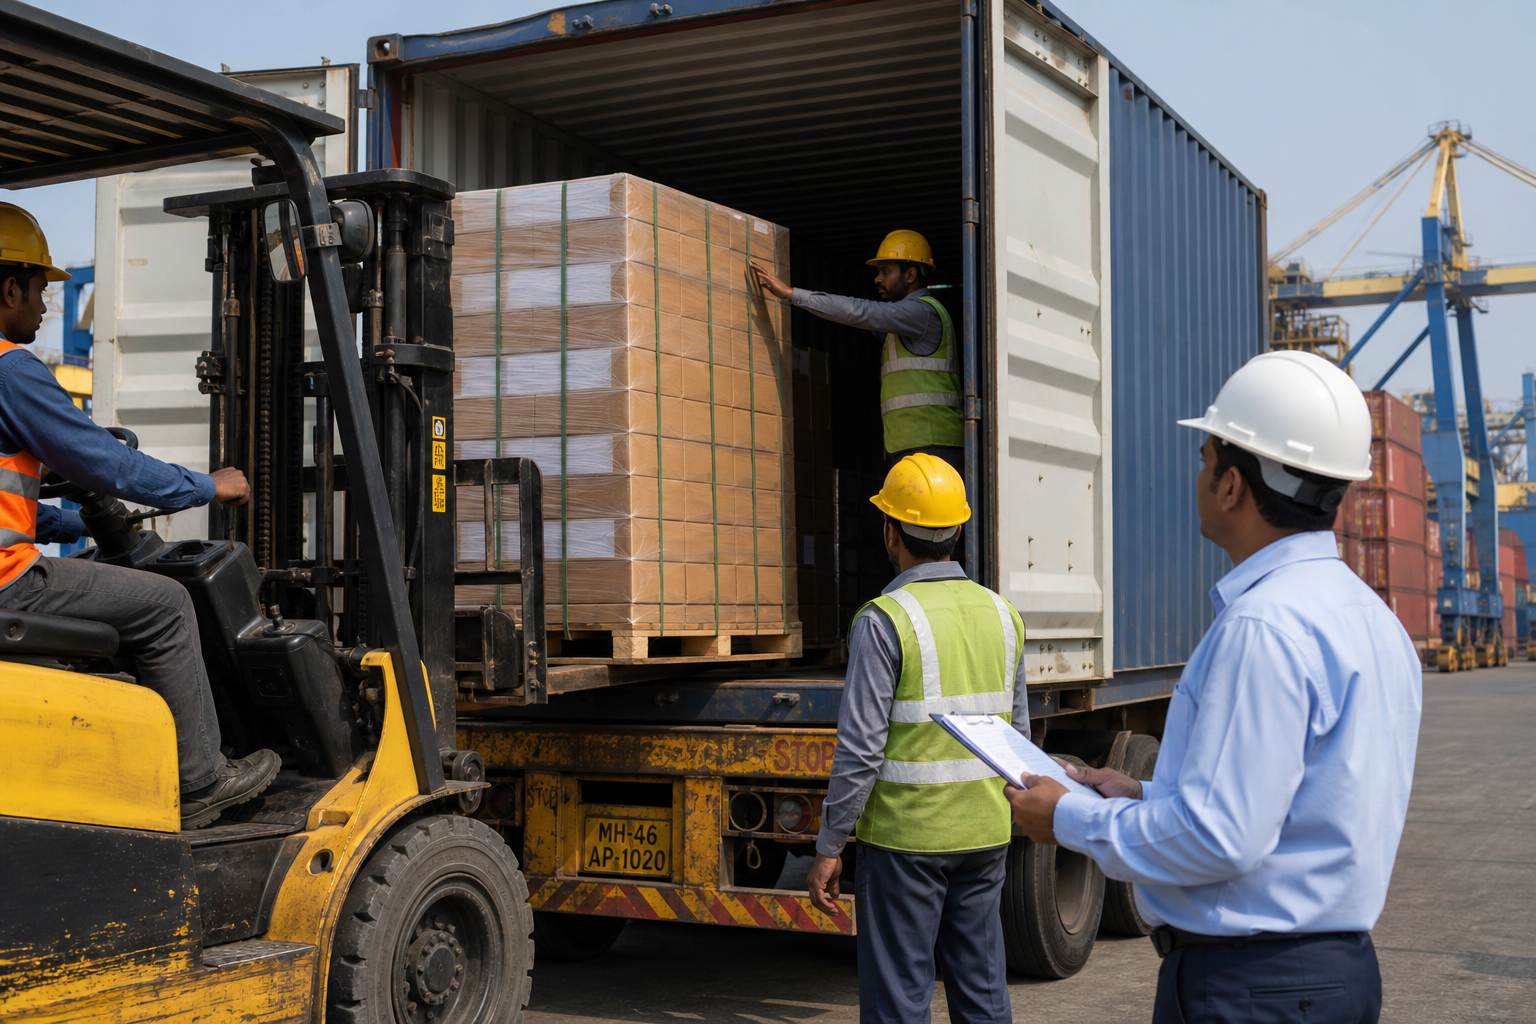
Working capital is a real cost even when it does not appear on a supplier invoice. Consider cash tied up in:
If your cost of capital is 10% annually and average cash-to-cash cycle from deposit to first sale is 120 days on a $5 landed-cost item, holding cost approximates:
$5 × 10% × (120 ÷ 365) ≈ $0.16 per unit
Longer lead times and higher advance percentages increase this layer. Suppliers offering faster production or better payment terms may win on TCO despite higher FOB.
Inventory risk also includes obsolescence, markdown, and storage fees at your 3PL. Model those if your category has seasonal or trend-driven demand.
Layer 8: Defect, return, and failure costs
- expected defect rate based on supplier history or category benchmarks;
- cost of sorting, rework, or repackaging at destination;
- returns from customers or retail chargebacks;
- write-offs and destruction of non-compliant goods;
- emergency air freight for replacement stock;
- lost sales and margin during stock-out periods;
- warranty or replacement unit costs.
Quality failures are where under-modeled imports become expensive. Capture:
Use expected value rather than pretending you can predict every failure:
Failure cost per unit ≈ (Defect rate) × (Average cost to remediate or replace one defective unit)
If defect rate is 3% and average remediation (return handling, replacement product, lost margin) is $8, expected failure cost is $0.24 per unit.
Suppliers with stronger QC history, clearer specifications, and PSI discipline often justify higher FOB. This is the core of TCO-based supplier selection.
Link prevention strategies to how to prevent quality problems when sourcing from India and how to verify product quality before shipping from India.
Layer 9: Buyer time and internal procurement cost
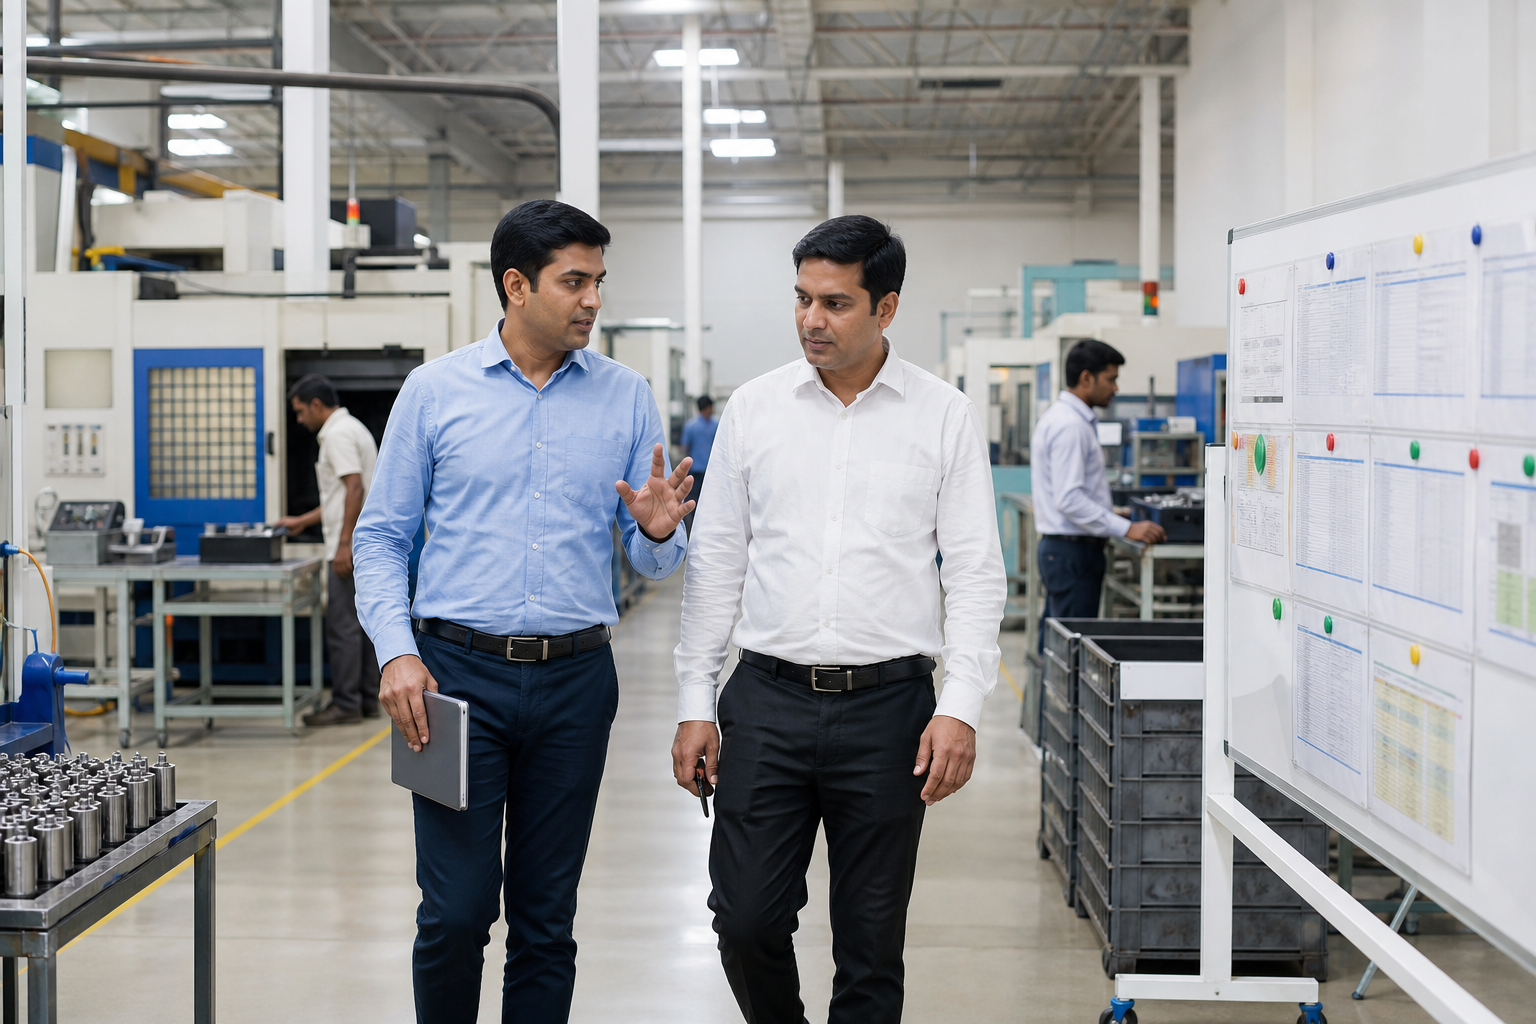
Estimate fully loaded hours for supplier search, negotiation, sample review, PO management, production follow-up, document review, broker coordination, and issue resolution. Multiply by your internal hourly cost and amortize across units.
Example: 40 hours at $75 fully loaded = $3,000, or $0.30 per unit on 10,000 pieces. A partner at $2,000 per order may reduce net TCO if it cuts internal hours—count the partner fee in Layer 5. DIY import is not automatically cheaper; it trades external fees for internal capacity.
Layer 10: Compliance testing and market certification
- FDA or NSF testing for food-contact or supplements;
- CPSIA and ASTM testing for children's products sold in the US;
- CE marking and EN testing for EU markets;
- FCC or UL requirements for electronics;
- organic, FSC, or sustainability certifications;
- labeling compliance review;
- post-import random testing by retailers.
Destination markets impose requirements that factory quotes rarely include:
Some tests occur on samples pre-production; others on production batches or arrival lots. Failed tests trigger retest fees, delays, and potential write-offs—often larger than the test fee itself.
Build a compliance matrix by SKU and market before comparing suppliers. A supplier experienced with your target market may reduce retest cycles and documentation errors, improving Layers 10 and 8 even if FOB is higher.

IBTCO-10 summary: building your TCO stack
- Calculate landed cost per unit using your Incoterm and destination duty assumptions.
- Add amortized pre-order costs: sampling (Layer 2), verification (Layer 3), and any development tooling.
- Add per-order QC and inspection allocated by unit (Layer 4).
- Add partner or coordination fees (Layer 5).
- Add payment and FX costs (Layer 6).
- Add working capital / holding cost for your cash cycle (Layer 7).
- Add expected failure cost using defect rate × remediation cost (Layer 8).
- Add internal time cost amortized per unit (Layer 9).
- Add compliance testing amortized across the batch or product life (Layer 10).
Use this sequence when modeling a supplier or order:
TCO per sellable unit ≈ Sum of Layers 1–10 (allocated consistently)
Document assumptions in a simple spreadsheet: supplier name, order quantity, Incoterm, expected yield, defect rate, and date of FX rate. Update TCO when any assumption changes—not only when FOB changes.
Comparison table: unit FOB vs landed cost vs TCO
The table below illustrates how the three metrics diverge for a hypothetical homeware SKU imported to the US. Figures are illustrative—not market quotes.
This pattern—cheaper FOB, higher TCO—is common when verification is weak, sample cycles drag, defects cluster, or the buyer absorbs heavy coordination load.
Comparison table
Swipe →
Data table — swipe horizontally on small screens
| Cost metric | Supplier A (low FOB) | Supplier B (higher FOB) | Notes |
|---|---|---|---|
| Unit FOB (USD) | $4.20 | $4.55 | A looks 7.7% cheaper on factory price |
| Landed cost per unit | $5.85 | $6.05 | B has better packing density; lower freight per unit |
| + Sampling amortized | $0.28 | $0.12 | A needed three sample rounds; B one approved sample |
| + Verification / audit amortized | $0.15 | $0.10 | Similar remote verification; A required extra video audit |
| + Inspection (PSI + inline) | $0.06 | $0.06 | Same plan for both |
| + Partner fee amortized | $0.00 | $0.18 | Buyer self-manages A; uses partner for B |
| + Payment / FX | $0.10 | $0.07 | A requires 50% advance; B accepts 30/70 |
| + Working capital (120-day cycle) | $0.19 | $0.14 | Tied to landed cost and advance % |
| + Expected failure cost (3% vs 1%) | $0.24 | $0.08 | A's category history suggests higher defect risk |
| + Buyer internal time | $0.35 | $0.15 | More hours chasing A's documentation delays |
| + Compliance testing amortized | $0.08 | $0.08 | Identical third-party test for both |
| TCO per sellable unit | $7.30 | $7.03 | B wins on TCO despite higher FOB |
Decision use case: when cheaper FOB loses on TCO
A US distributor compares two suppliers for 12,000 kitchen tools. Supplier A quotes $3.95 FOB with two sample rounds, 50% deposit, weak documentation history, and no PSI hold. Supplier B quotes $4.30 FOB with one sample revision, balanced payment milestones, PSI before dispatch, and partner coordination at $1,800.
Landed cost: A ≈ $5.60/unit; B ≈ $5.78/unit. TCO drivers flip the ranking: A adds ~$0.22/unit in sampling and buyer time, ~$0.18/unit in expected failures (2.5% vs 1% defect assumption), and ~$0.08/unit in working capital. B's partner fee adds ~$0.15/unit but saves ~$0.20/unit in internal time.
Result: B wins by roughly $0.25–$0.35 per unit ($3,000–$4,200 on the PO) despite 9% higher FOB. Negotiations should target payment terms, inspection hold, and spec discipline—not unit price alone.
How TCO connects to your import playbook
Apply IBTCO-10 at supplier shortlisting (Layers 2–4, 8, 10), Incoterm and payment negotiation (1, 6–8), partner model selection (5, 9), freight booking (1, 7), PSI release (4, 8), and reorder decisions (all layers with actuals). See how to import products from India and the India import process map. For category strategy, see the legacy complete guide to importing products from India.
Common mistakes when calculating total cost
Common Mistakes Box
Mistake 1: Treating landed cost as total cost
Landed cost is Layer 1 of IBTCO-10. Stopping there systematically favors suppliers that externalize cost into defects, delays, and buyer labor.
Mistake 2: Ignoring amortization logic
A $5,000 verification program means little per unit over a multi-year volume—but dominates a trial order of 500 units. Match amortization period to the decision you are making.
Mistake 3: Using quoted FOB without yield adjustment
If you expect 4% unsellable units, divide landed costs by expected sellable yield or model failures in Layer 8—not both in conflicting ways.
Mistake 4: Double counting partner fees
If your merchant exporter quote is all-in CIF including coordination, do not also add a separate partner layer unless fees are truly additive and documented.
Mistake 5: Zero defect assumptions
Unless you have PSI acceptance data and stable specifications, assume non-zero failure cost. Zero-defect models flatter first-time supplier relationships.
Mistake 6: Comparing suppliers on different Incoterms without normalization
Normalize to the same delivery point before comparing Layer 1. See FOB vs CIF vs EXW.

Conclusion
Calculating the total cost of buying products from India requires more than comparing FOB quotes or stopping at landed cost. The IBTCO-10 model gives international buyers a repeatable way to stack ten cost layers—from warehouse arrival economics through sampling, verification, QC, partner fees, financing, working capital, failures, internal time, and compliance—so supplier decisions reflect true program cost.
Use landed cost as the foundation, then add the layers your product, market, and operating model actually trigger. Compare suppliers on TCO per sellable unit with documented assumptions. The lowest factory price is often not the lowest-cost way to fill your warehouse.
If you want help building supplier comparisons and import cost visibility for India sourcing, share your product brief, target market, and volume expectations with Altus Exports. A structured first discussion can clarify which IBTCO-10 layers matter most for your category.